Litecoin (LTC)—one of the most preferred altcoin investments for the long-term is seen trading below $60 with a bearish crossover due to a lack of steady momentum. Just as Bitcoin continues to consolidate below $12k and now even below $11.5k, the major altcoins like BSV, BCH and LTC are facing a similar retreat as they test the short-term supports.
The majority of the cryptos, including BTC, have retrieved to 5-month highs after trading around the notable lows during massive sell-off in March. In this regard, Litecoin has strengthened by over 180% after nosediving as low as $25 in March 2020.
Litecoin is one of the major performers amongst the top 10 cryptos of the market but is believed to be marginally influenced by Bitcoin and its movement. LTC is drawing a bearish move after reclaiming 5-month height but facing a stringent resistance at $70. With a bearish consolidation, Litecoin is currently testing supports below $60 at $57, i.e., around 38.20% Fib Retracement level.
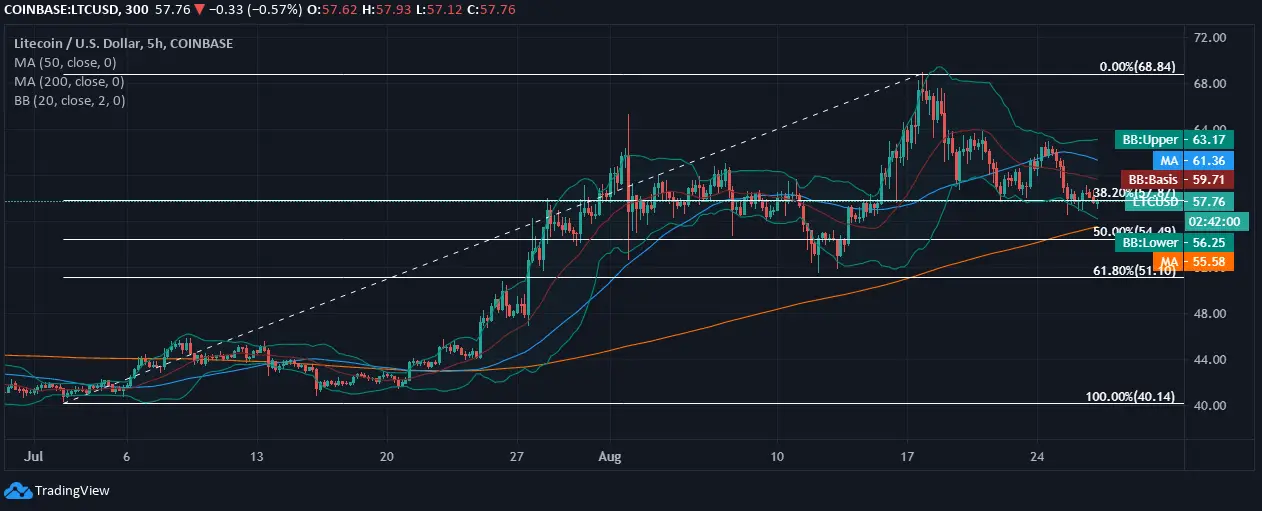
On the above 5-hourly chart, LTC/USD is seen drawing a triangle pattern as it draws the plummeting tangent due to lack of traction below $60. The price trend of Litecoin is breaching the lower 20-day Bollinger Band, but the bands do not draw any extremities.
The major and immediate support lies at $55, i.e., 50.0% Fib level on the 5-hourly chart and will be moving towards testing support at MA200. However, due to a moderate bearish divergence, Litecoin has already lost support from 50-day daily MA at $61.77.