Bitcoin Price Tests Make-or-Break Resistance at $125K

- Bitcoin price faces overhead supply pressure at the psychological level of $125,000.
- BTC’s net taker volume at neutral reflects diminished selling pressure from derivative traders.
- Whale accumulation and ETF inflow continue to bolster Bitcoin for higher recovery rally.
The pioneer cryptocurrency, Bitcoin, jumped over 2% on Wednesday, 9th October. The buying pressure came as an immediate response to Tuesday’s sell-off, as investors rushed to accumulate more BTC, signaling a buy-the-dip sentiment. The bullish streak in spot ETF inflows and increasing whale buying pressure reinforces the Bitcoin price for a new high in “Uptober.”
BTC Whale Buying and ETF Inflows Strengthen Market Sentiment
By press time, the Bitcoin price trades at $124,228, registering an intraday gain of 2.32%. Meanwhile, the asset’s market cap surged to $2.46 trillion. The recovery followed a short-term sell-off earlier in the week, as the large holders started re-entering the market and the exchange data showed accumulation activity increasing.
Data from blockchain monitor Lookonchain showed several large transactions within the last 24 hours. One address, known as bc1qr9, moved out approximately 650 BTC – equivalent to nearly an $80 million sum – from Binance, bringing its current total to more than 2,091 BTC, equivalent to approximately $257 million. Another new wallet, 35usJu, was seen receiving 1,183 BTC (approximately $144 million) from Galaxy Digital, while another address, 1EPzzK, received 500 BTC (approximately $60.8 million) from BitGo.
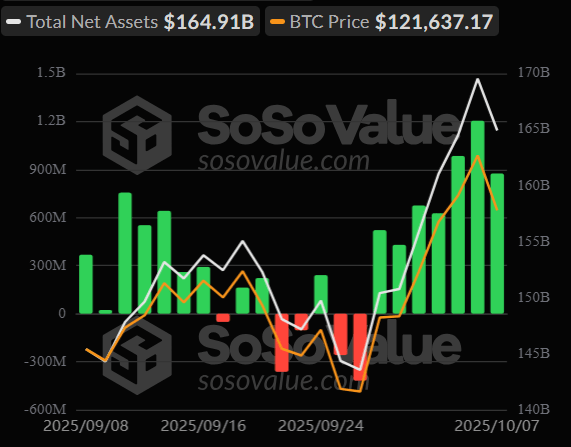
These transfers are a complement to a sustained spate of inflows into U.S.-listed Bitcoin spot exchange-traded funds (ETFs). Over the past seven sessions, spot ETFs have seen more than $5.3 billion in new capital, which is an indication of continued institutional interest despite recent volatility.
The CryptoQuant analysis shows that there is a significant change in the derivatives market. The platform’s data revealed that net taker volume (a metric that compares aggressive buy and sell orders) has shifted from strongly negative values in the vicinity of -$400 million to a more positive, neutral level. Historically, such shifts have coincided with periods of less selling pressure and a return to a balance between buyers and sellers.
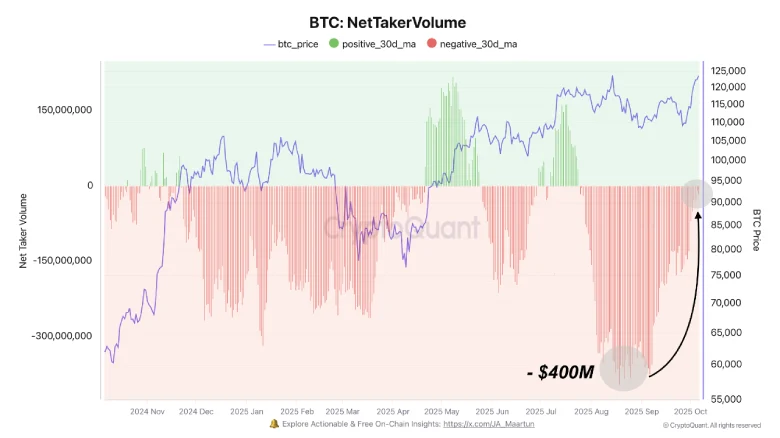
Market watchers may recall a similar shift in the April pullback, after which market activity calmed down and directional movement picked up strength. The current shifting means that derivatives players are no longer pressuring its market lower, but experts warn that a sudden swing to any sort of strongly positive net taker levels would rapidly change near-term dynamics.
Bitcoin Price Stalls At Make-or-Break Resistance
Earlier this week, the Bitcoin price broke the previous all-time high of $124,517 to reach a new peak of $126,272. However, the surge happened for a split second and the price reverted with a 2.67% loss during Tuesday’s market.
The resulting red candle, with a range from $120,648 to $125,234 in the daily chart stands as a decisive challenge from sellers, crucial for market participants as it reflects the seller’s challenge at key resistance. If the coin price breaks below the candle low of $120,648, the sellers’ pressure will accelerate and drive an extended correction to $113,542.
However, the buyers managed to prevent a follow-on on the downside, with a notable green candle of +2%. If the current price manages to breach the overhead resistance of $125,270, the bullish momentum will intensify. The post-breakout rally could push the price another 7.6% to hit the overhead boundary at $135,000.
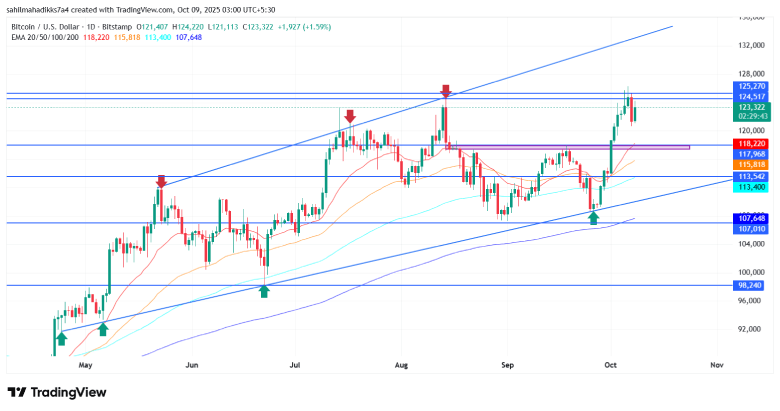
The sharp upstream in daily exponential moving averages (20, 50, 100, 200) supports the bullish narrative for prolonged recovery.
Also Read: Gold Prices Breaches $4,000 as Global Instability Fuels Unprecedented Rally