Bitcoin Price Eyes $117k Breakout With this Bullish Pattern

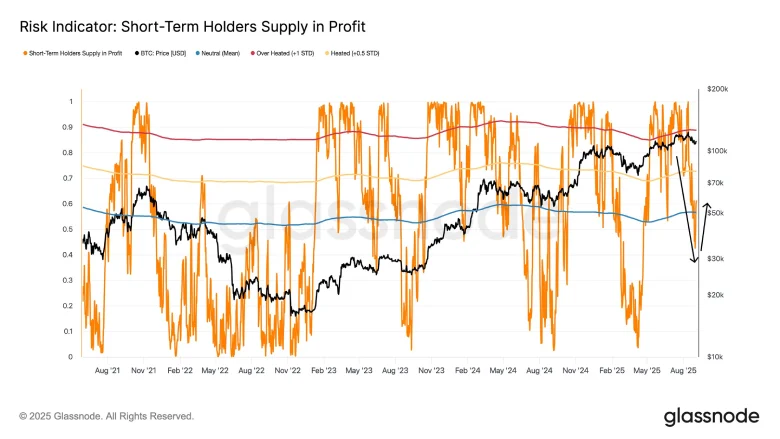
- Bitcoin’s short-term holder profitability slumps from 90% to 60%, projecting a neutral yet fragile market sentiment.
- The Bitcoin price forms a bullish reversal pattern called the inverted head and shoulders pattern to reattempt the $113,650 breakout.
- BTC’s fear and greed index dropped to 48%, indicating a neutral sentiment among market participants.
On Thursday, September 4th, the Bitcoin price fell over 1.08% to reach $110,566 in trading value, continuing its prevailing correction trend. The market uncertainty about the September rate cut and the U.S.-imposed tariffs on several countries are among the key factors fueling this correction. The falling BTC price is poised for a key support test at $107,471, signaling a pivot moment for further breakdown or reversal. The recent on-chain data highlights a potential consolidation in price for buyers to recoup bullish momentum. Will Bitcoin regain $120,000?
Glassnode Flags Cooling Demand as Bitcoin Price Holds Fragile Support
Over the past three weeks, the Bitcoin price has exhibited a sharp correction, falling from $124,517 to the current trading value of $110,597, which represents an 11.22% loss. A notable contributor to this downtrend is uncertainty surrounding the U.S. Federal Reserve’s monetary policy and recently imposed tariffs by the U.S. under the Trump administration.
However, the correction trend shifts to a so-called “air gap” between the $104,000 and $116,000 range. On-chain analytics platform Glassnode highlights that the futures and ETH inflows are showing signs of cooling demand, suggesting a waning appetite from market participants.
Furthermore, the recent market correction pushed the profitability of short-term holders from 90% to 42% before stabilizing near 60%. This move accentuates that the market is neutral but fragile. For buyers to regain momentum, the price must break the $116,000 barrier.
On the contrary, a correction below the recent support could drive a correction towards $93,000 and $95,000
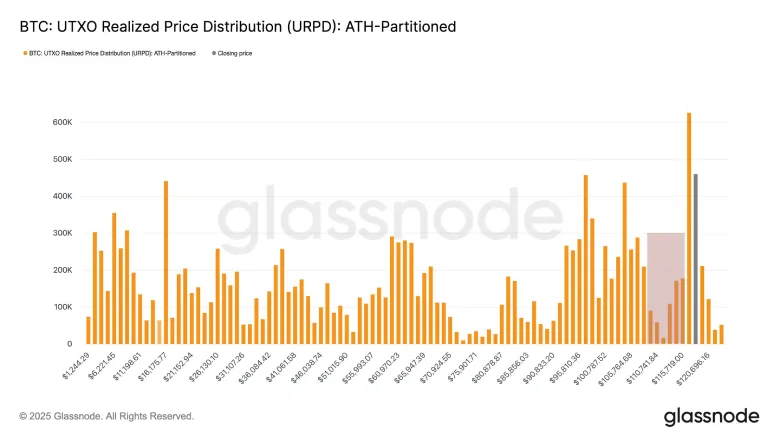
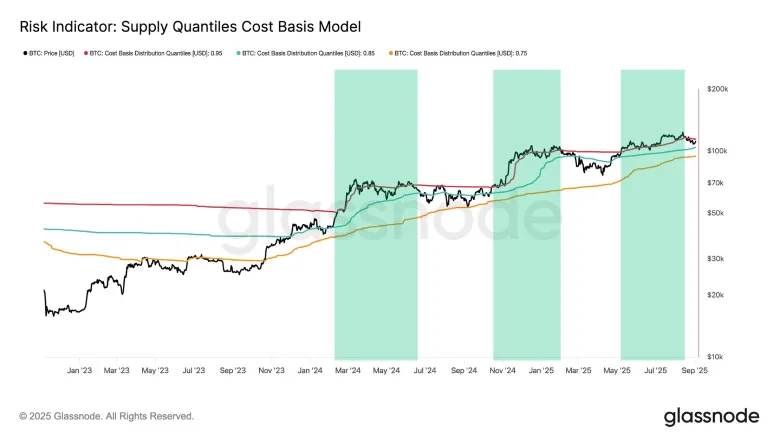
The analytics platform also highlighted that the recent all-time high of $124,517 was the third euphoric phase of this cycle. Following this surge, Bitcoin retraced into the 0.85-0.95 quantile cost basis zone. Historically, this area has triggered a sideways action in price for prevailing bullish momentum to recoup and offer a major move.
Inverted Head and Shoulder Pattern Set Bitcoin For Recovery
In the 4-hour time frame, the Bitcoin price seeks bullish support at the $107,420 floor. The price rebounded from this horizontal level with a V-shaped recovery, indicating a sharp surge in market buying pressure.
Even with today’s intraday sell-off, the sellers attempted to reclaim the $110,000 level but failed to sustain the lower price, resulting in a sharp rejection. This upswing revealed the formation of a bullish reversal pattern called an inverted head and shoulders.
The chart setup is characterized by three troughs, with the middle trough (head) being the lowest, flanked by two higher troughs (shoulders). Typically, the pattern bolsters a bullish breakout from its neckline resistance as a signal for renewed market recovery.
Currently trading at $110,704, the BTC price is just 1.6% away from a breakout of overhead resistance at $112,500. A successful breakout with a 4-hour candle closing will renew bullish momentum in the market and bolster a surge past $113,650 and $117,000.
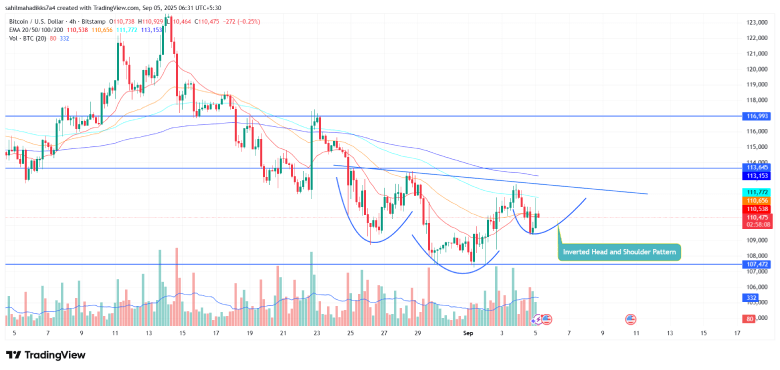
This upswing will also reclaim the 20- and-50-day EMAs on the buyers’ side to bolster recovery momentum.
However, if the selling pressure of $113,650 resistance persists, the coin price could reattempt a breakdown below $107,500.
Also Read: CFTC Gives Green Light to Polymarket to Re-enter the U.S.