Will Ethereum Follow Its Historical Trend? October Price Prediction

- Ethereum price has showcased a history of recovery sentiment in October, projecting an average gain of 7% over the past decade.
- A bull-flag pattern drives the current correction trendline in the ETH price.
- A steady drop in Ethereum’s open interest shows that derivatives traders remain hesitant to commit aggressively.
On Tuesday, September 30th, the Ethereum price reverted from $4,250 and plunged by over 2.75%. The pullback suggests that the broad market relief rally ran out of steam, and cryptocurrencies may resume their corrective trend. A notable decline in the futures contracts tied to ETH accentuates the weakening speculative force behind the price. Can “Uptober” sentiment prevent the top altcoin from a major breakdown?
ETH Uptober History Faces Market Hesitation
Ethereum’s historical performance in October has frequently fueled the popular crypto community narrative of “Uptober”, as a month of bullish sentiment in digital assets. Looking at the data, Ethereum has been on a positive trend for October, with some exceptions. Over the last decade, ETH has shown some noteworthy gains in October, with notable increases of +24.8% in 2015, +42.8% in 2021, and +8.61% in 2023. These powerful rallies were often during broader market optimism or recovery phases.
On average, Ethereum has been delivering +7.00% returns in October, and the median is slightly higher at +4.60%, which indicates that while there have been some years with explosive gains, some years have ended flat or with mild losses. For example, October closures were in the red for 2016, 2018, and 2024, indicating that the month isn’t a guaranteed bullish month but is a historically positive period.

The cyclical strength of October has helped to cement the Uptober sentiment, with traders and investors speculating around seasonal strength as well as renewed inflows into the market. With past Octobers proving to be turning points ahead of year-end rallies, many are looking to see if Ethereum will be able to replicate its historical bias this year.
That said, volatility is always a constant, and lingering uncertainty about new tariffs and inflation pressures could change market momentum quickly.
In addition, Ethereum’s price relief rally is demonstrating a lack of conviction as futures open interest is struggling to improve. Coinglass data puts open interest at $55.9 billion, continuing its declining trend despite the recent uptick in price.

Historically, synchronised growth in price and open interest has offered greater confirmation of sustainable rallies. For now, the absence of OI recovery is indicative of a hesitant market, and a significant upswing in open interest will likely be required to confirm Ethereum’s current price action.
Ethereum Price Holds Key Support For Reversal
Since last weekend, the Ethereum price has shown a notable recovery from $3,820 to $4,238, accounting for nearly 10% growth. However, the relief rally faced renewed selling pressure at 20 and 50-day exponential moving averages, resulting in a sharp 2.4% drop today to hit $4,170.
If the sellers manage a follow-up red candle breaking below the $4064 floor, the coin price could extend its downtrend to $3,677. The potential bottom could occur at the support trendline of the ongoing flag pattern.
On the contrary, if the Ethereum price breaks above the 20-day EMA, buyers could strengthen their grip on this asset, leading to a continued recovery. The post-breakout rally could push the price 7% to challenge the flag pattern.
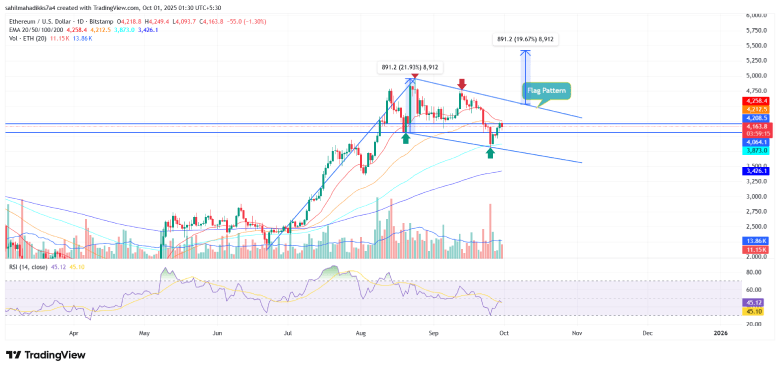
A bullish breakout from this resistance could add conviction for an “Uptober” rally.
Also Read: Jim Cramer Calls Crypto ‘Fine’ and Hedges Against US Debt