Binance Coin with a Volatile Movement Draws Bullish Crossover

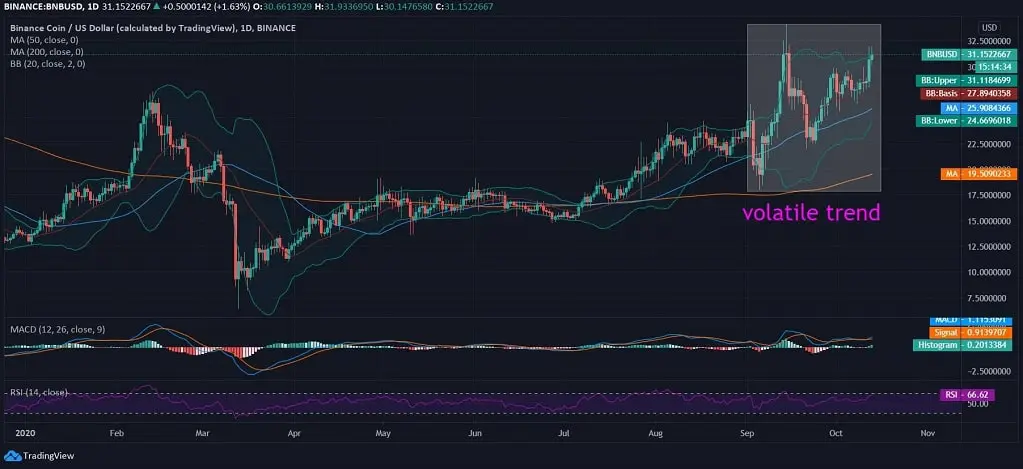
Binance Coin, with a strong bullish intraday movement, is seen breaching the 15-month resistance as the price crosses above $30, and at the time of writing, the price spotted at $31. BNB coin is believed to be the currency of long-term investment, and with the current price rally, it is currently one amongst the top 10 coins of the market.
In March, when Binance Coin’s price was seen dropping below $6.5 and with a gradual rise, it spiked as high as $24 by the end of August. The current price movement of BNB/USD is just absolutely right as it breaks above $30 after a volatile 5-week price movement. Binance Coin has reclaimed above the YTD high that it had hit in the early half of the ongoing month before the major market crash.
$BNB Time to become a party pooper pic.twitter.com/DsM1go94JU
— the dude (@cryptodude999) October 12, 2020
Binance ecosystem is just the right example of lucrative altcoins gaining all the strength and marking a fresh rally in the global crypto market. If the Binance Coin price continues to keep up the same momentum, it will likely cross the major resistance at $35 soon.
01 – $BNB
Pretty clean levels so far and a break out here.
I miss when $BNB would start alt rallies. pic.twitter.com/feXmhhBXRy
— Loma (@LomahCrypto) October 12, 2020
Binance Coin Price Analysis
 Binance Coin News
Today, Binance Coin was seen trading at $31 after a volatile 5-7-week price trend observed over the past month. With bullish movement on the daily chart, BNB/USD is already breaching the upper band. In the previous month, BNB price was seen rushing above $30 at $33.9, and with yet another price move, it breached the 5-week resistance.
On the daily chart, Binance Coin is holding support from SMA50 & SMA200 lines at $25 & $19, respectively. The MACD indicator shows a real bullish crossover. The RSI also shows a stringent inclination towards the overbought region at 66.62, as per the price led to the demand for the security in the global crypto market.
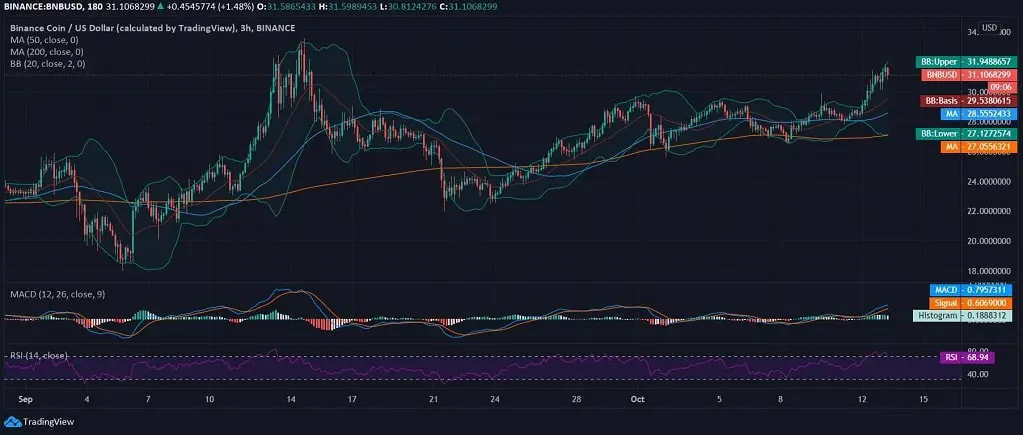
Binance Coin, on the above 3-hourly chart, is seen rising gradually over the past three weeks against the US Dollar. On the same chart, BNB/USD is already breaching the upper 20-day Bollinger Band, and the Bands are gradually seen widening that projects less to the moderate volatile movement of the coin in the near-term.
The coin retains support from 50- & 200-day moving averages on the 3-hourly chart and around $27 and $28. MACD draws a bullish crossover, and the RSI records a strong inclination towards the overbought region at 68.94.
Related Cryptocurrency Market News – MCO News