Solana Price Exits 6-Month Channel To Chase $250 High
- The Solana price gives a bullish breakout from the resistance trendline of a long-coming channel pattern.
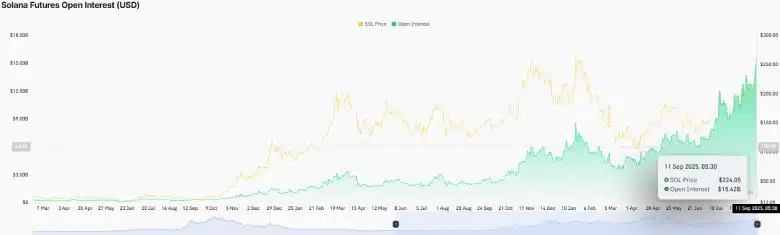
- SOL futures open interest shows a 17% jump in the last four days, indicating heightened trader activity and speculative force added to the price.
- The coin price challenging the upper boundary of Bollinger Band indicators accentuate the aggressive nature of buyers to drive higher rally.
On Wednesday, September 10th, the Solana price jumped 2.77% to trade at $223.3. While the buying pressure aligns with recovery in the broader crypto market, the SOL price gained additional momentum amid large investors buying and a sharp surge in open interest. The rising price currently teases a bullish breakout from the resistance trendline of a channel pattern, signaling a potential for a higher rally. Is a rally to $250 next?
Solana Soars as Futures and On-Chain Activity Heat Up
In a 4-day rally, the Solana price jumped from $200.12 to $223.6, registering an 11.75% gain. Subsequently, the asset’s market cap surged to $121.23 billion.
Along with the price rally, Solana is experiencing a resurgence in its future market action, signalling increased trader interest. Since last weekend, SOL open interest has bounced from $12.36 billion to $14.51 billion, indicating that market participants are increasing or opening new positions in the market.
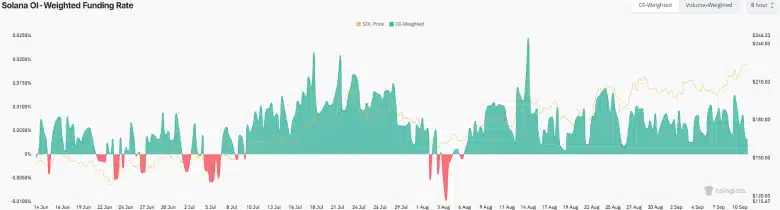
This surge is accompanied by an improvement in the funding rate, which is weighted by open interest into positive territory, standing at 0.0083% currently. It indicates that the levels of long positions are slightly prevailing over the short positions, indicating a cautious optimism among futures traders.
Alongside derivatives activity, on-chain movement is also indicative of a great level of investor activity. Earlier today, four newly made wallets withdrew about 101,824 SOL, estimated to be worth approximately $22.5 million, from the Binance exchange. These withdrawals can reflect a preference to store in private wallets or long-term, as opposed to assets being stored on centralized exchanges, or may reflect preparations to stake or be part of strategic deployments.
Such a combination of increasing futures involvement and significant on-chain transfers indicates that Solana is an active market environment, and participants are trading ahead of any potential price changes.
Solana Price Breaks out of a 6-Month Pattern
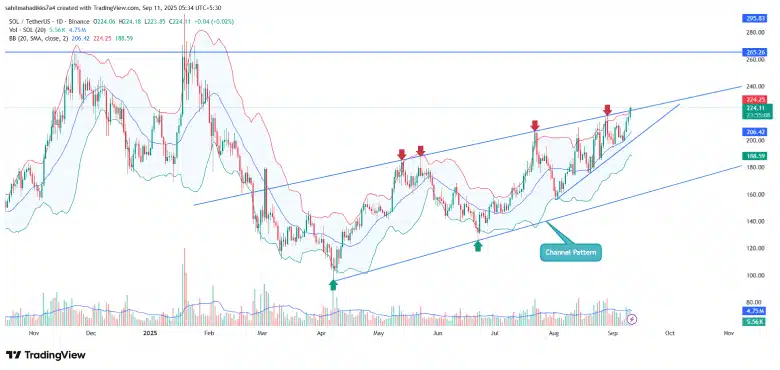
With today’s price jump, the Solana price shows a bullish breakout from the resistance trendline of a rising channel pattern. Over the past five months, the coin price has bounced twice from the bottom trendline and four times from the resistance trendline, indicating how strongly the pattern is shaping the price trajectory.
Generally, the ascending channel pattern drives a steady uptrend in a series of higher-high and lower-high formations. However, an upside breakout from this pattern indicates the buying pressure is increasing, setting the price for a drastic rally ahead.
The coin price challenges the upper boundary of the Bollinger Band indicator, accentuating the dominating nature of buyers to lead this coin. The formation often suits a breakout position. If the price holds this breakout and volume action increases, the buyers could bolster an 18% jump to $265.
Another breakout from this resistance is crucial for the price to chase the $300 psychological level.
On the contrary, the coin price could possibly retest the breached trendline to validate its sustainability for the next leap. If the potential retest enters the channel range, the sellers could attempt to regain control on this coin.
If materialized, the previous breakout would be marked as a bear trap, and the coin price could enter a renewed correction fall.
Also Read: JPMorgan Says Crypto Adoption Is Just Getting Started