
Ethereum—the massive altcoin by market capitalization is seen drawing an intraday bullish crossover after a pulling back below $380 and trading around $370. Moreover, the price movement of major altcoins has been notably volatile. While Bitcoin consolidates below $11.5k, major altcoins like BNB, ADA, LINK, LTC, including ETH, are seen drawing volatile yet bullish crossovers due to no steep setbacks.
While Ethereum is the oldest and 2nd generation cryptocurrency ranked right after Bitcoin, it faces difficulties in engaging DeFi with the layer 2 Ethereum. However, as per the latest update, the massive trading platform, Coinbase, and its wallet, is readily supporting layer 2 Ethereum. While the smart contract platforms like Cardano lure all the limelight, Ethereum needs to gear up to support DeFi and come up with this innovation.
Ethereum Price Analysis
 Ethereum News
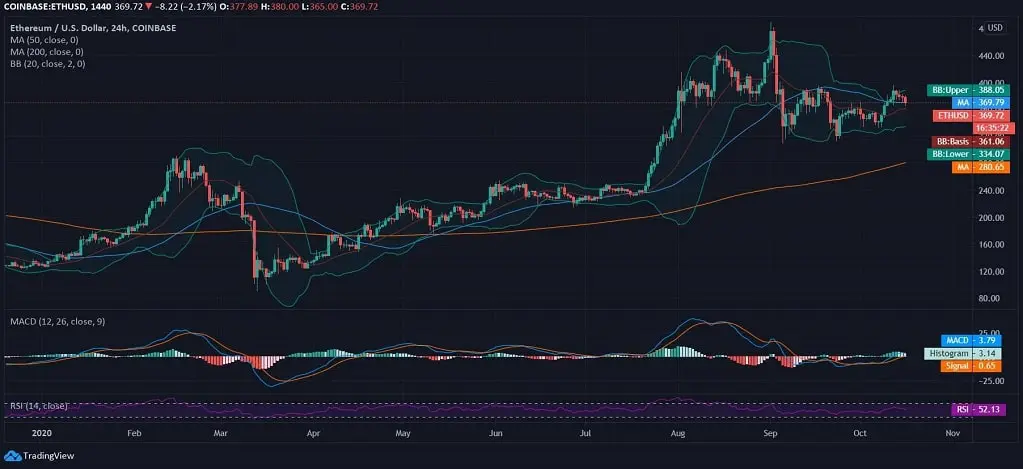
Today, Ethereum was seen trading at $370, with a volatile movement recorded after hitting a fresh YTD high at $488, with a strong resistance faced at $500. With an intraday downside correction, ETH is slightly shifting away from the upper band. While the volatility takes over, Ethereum is failing to retain support from SMA50 due to quick price change at the time of writing.
Moreover, the Bollinger Bands do not show any possibility of volatile breakout as soon as the market trend does not follow any specific pattern. The MACD chart retains the bullish divergence. The RSI is seen affecting from an intraday pullback, and therefore, with a smooth drift, it lies at 52.13.
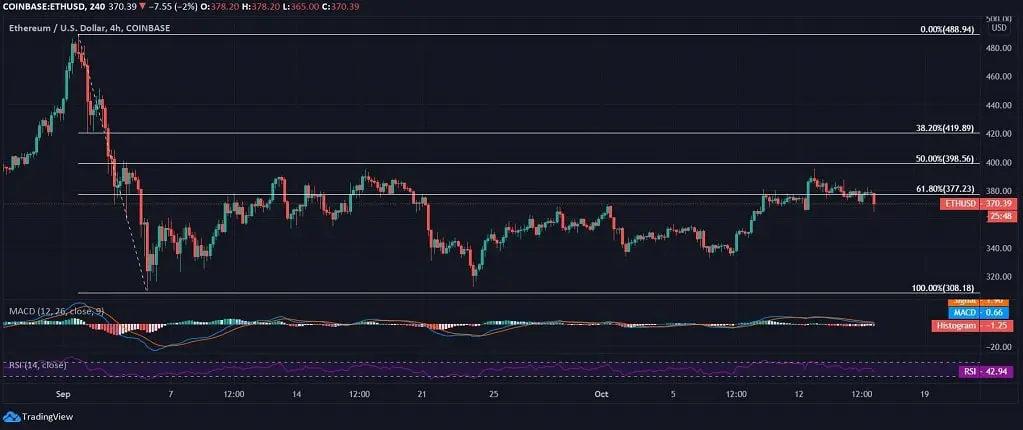
While taking an emphasized view of ETH/USD’s 6-week movement, we clearly see that the coin is facing stringent resistance after hitting the YTD high at $488 is seen consolidating below the 61.80% fib level on the 4-hourly chart. Therefore, the intraday pullback confirms the bearish divergence after drifting below $395.
The MACD chart confirms the bullish divergence, and the signal line crosses above the MACD line, contrary to that of the daily chart. The RSI also shifts from the overbought zone due to price slash and currently lies at 42.94.