Horizen Gains 200% in 4 Months After Testing Support at $3.03

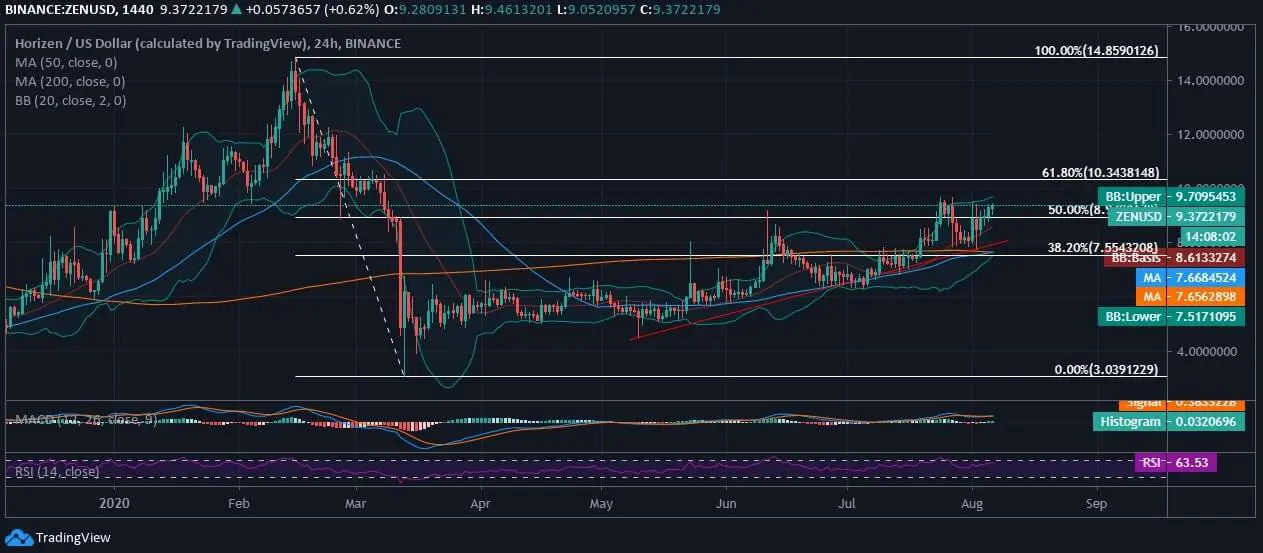
Horizen (ZEN), at the time of penning down this analysis, was seen trading at $9.37 and is now above 50.0% Fib level. It was until the first week of the previous month when the price trend of ZEN/USD was seen consolidating below 38.20% Fib level. With intraday bullish crossover, the currency is drawing a bullish candlewick after testing supports as low as $7.55 at the onset of the ongoing month.
Horizen is one of the top 100 coins of the global crypto market and is seen gaining momentum as the major coins of the market are seen trading in green. Bitcoin, the major cryptocurrency by market capitalization, is seen reclaiming yearly heights above $11.5k, around the press time.

On the 24-hourly chart, ZEN price is trading at $9.37 and is drawing an uptrend since May 2020. With a continued uptrend, Horizen price rose above 38.20% Fib level, and with intraday strengthening, the coin is now above 50.0% Fib as well. The price trend of ZEN/USD is around 20-day upper Band due to intraday momentum, and the coin is retaining support from MA50 & MA200.
The Bollinger Bands are not exhibiting any trading extremities, and therefore, we do not project any steep breakout. ZEN, on the other hand, had recovered by almost 200% after the market crash in March when it had hit the lowest at $3.03 while now trades above $9. With the recent gain in momentum, the coin is trading well but is likely to face strong resistance at and around $10.
With intraday positive sentiment, the MACD chart holds a slight bullish crossover as the intraday price of the Horizen soared from $8.8—Which has been the lowest since yesterday until the time of writing. The RSI is inclined towards overbought region due to intraday gain of momentum but holds no extremities at 63.53.