Will Terra (LUNA) Continue Its Price Rally Further?

Terra is a decentralized blockchain platform aiming to combine the reliability of stable coins with blockchain. It uses a protocol to stabilize the stable coins, including automated market makers, which can be traded in both directions.
Terra has reserved many stable coins pegged into Fiat currencies, and when the demand for stable coins rises in the market, the price of the stable coins goes above the peg, and the protocol controls the inflation by issuing new stable coins to bring it closer to the peg.
It runs on Proof of Stake algorithms and Tendermint smart contracts, enabling the Terra stable coins to collateralize. It is also used as a governance coin and stabilizes reward for staking.
It was created in 2017 by Do Kwon and Daniel Shin. They created it as an international system for payments. Finally, it was launched in 2019. The project was backed by 15 large companies, which are known as Terra Alliance.
LUNA is a native token on the platform and plays a vital role in maintaining the platform. It is also used for staking stable coins. The supply of LUNA coin is not fixed because it has been burned and minted constantly, but it has a hard cap of 1 billion.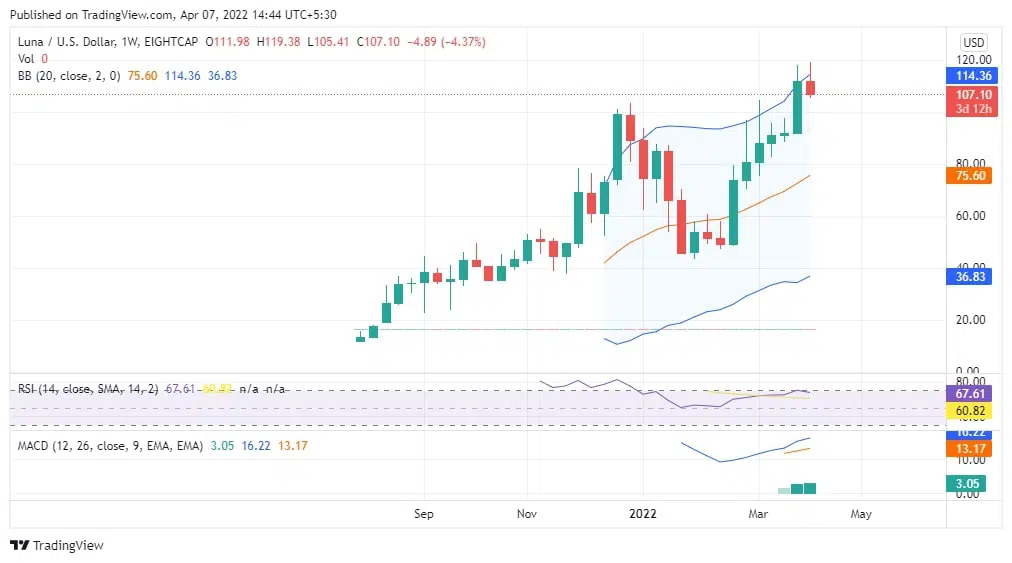
At the time of writing, the price of LUNA is trading around $105.5. The chart is bullish in the long term because it has been forming higher lows and higher highs. However, the latest weekly candle is red, but we think it will take support and form another green candle in the next two weeks. The main technical indicators such as MACD and Bollinger Band are bullish in the long term. RSI is also stable at around 66. Based on the current price momentum and LUNA coin price prediction, it will continue its bull run.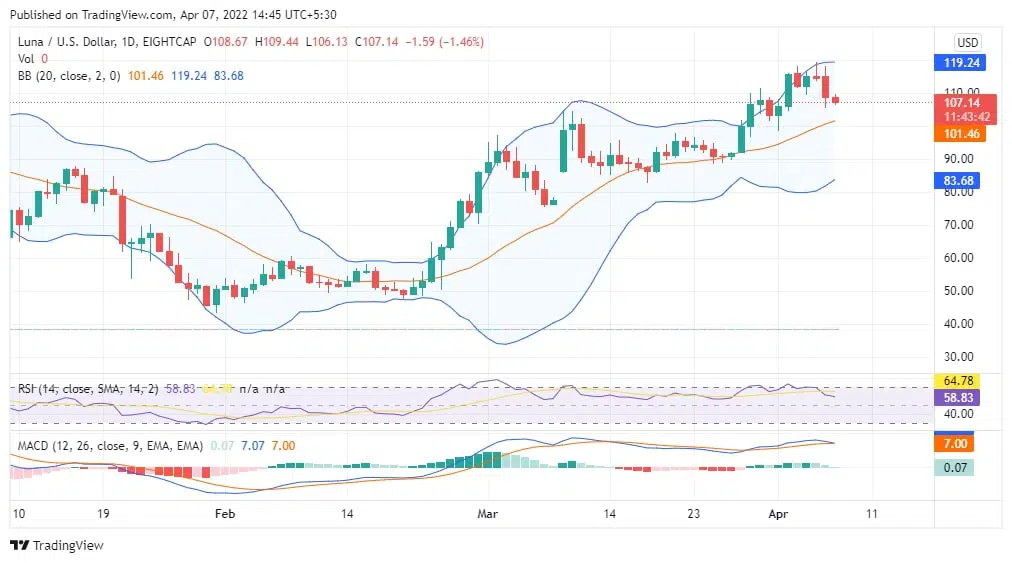
However, in the short term, the chart is bearish. This week it has reached an all-time high of $118, but now it is consolidating and may take support around $110. If it breaks this support level, the next support will be around $90, and we think the price will not break this level. On the daily chart, MACD is bearish; RSI is stable around 56. Moreover, candlesticks are forming just over the baseline of the Bollinger Band. If you want to invest for the long term, you should start investing around $90, where it will find support. It is a good chart for long-term holding. Please follow our website to get the latest updates on cryptocurrencies.