Binance Coin with a Volatile Movement Draws Bullish Crossover

Binance Coin, with a strong bullish intraday movement, is seen breaching the 15-month resistance as the price crosses above $30, and at the time of writing, the price spotted at $31. BNB coin is believed to be the currency of long-term investment, and with the current price rally, it is currently one amongst the top 10 coins of the market.
In March, when Binance Coin’s price was seen dropping below $6.5 and with a gradual rise, it spiked as high as $24 by the end of August. The current price movement of BNB/USD is just absolutely right as it breaks above $30 after a volatile 5-week price movement. Binance Coin has reclaimed above the YTD high that it had hit in the early half of the ongoing month before the major market crash.
Binance ecosystem is just the right example of lucrative altcoins gaining all the strength and marking a fresh rally in the global crypto market. If the Binance Coin price continues to keep up the same momentum, it will likely cross the major resistance at $35 soon.
Binance Coin Price Analysis
 Binance Coin News
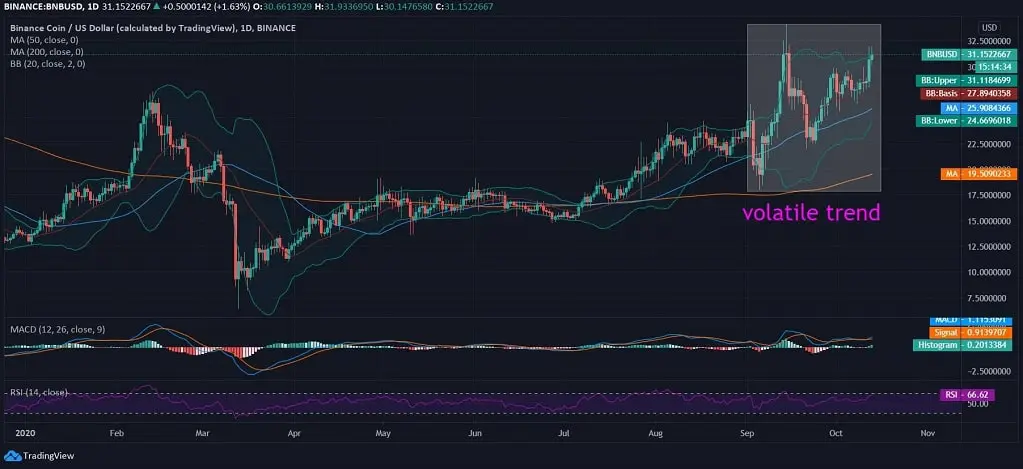
Today, Binance Coin was seen trading at $31 after a volatile 5-7-week price trend observed over the past month. With bullish movement on the daily chart, BNB/USD is already breaching the upper band. In the previous month, BNB price was seen rushing above $30 at $33.9, and with yet another price move, it breached the 5-week resistance.
On the daily chart, Binance Coin is holding support from SMA50 & SMA200 lines at $25 & $19, respectively. The MACD indicator shows a real bullish crossover. The RSI also shows a stringent inclination towards the overbought region at 66.62, as per the price led to the demand for the security in the global crypto market.
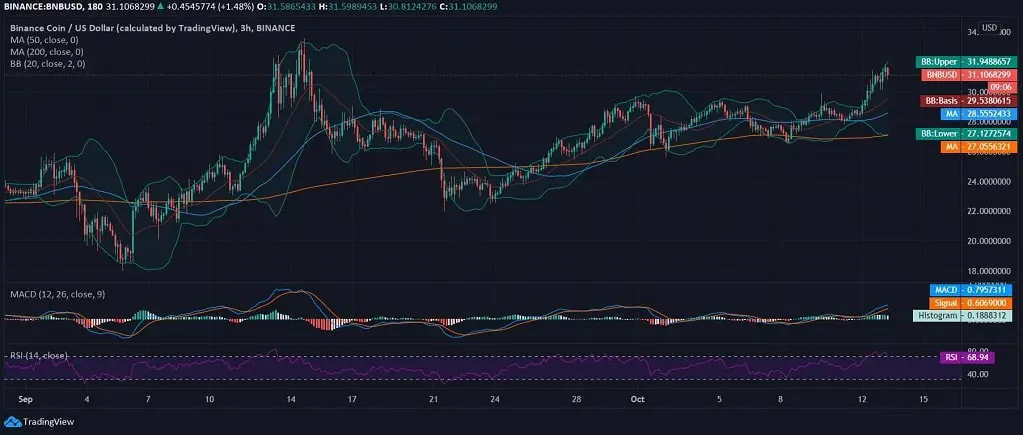
Binance Coin, on the above 3-hourly chart, is seen rising gradually over the past three weeks against the US Dollar. On the same chart, BNB/USD is already breaching the upper 20-day Bollinger Band, and the Bands are gradually seen widening that projects less to the moderate volatile movement of the coin in the near-term.
The coin retains support from 50- & 200-day moving averages on the 3-hourly chart and around $27 and $28. MACD draws a bullish crossover, and the RSI records a strong inclination towards the overbought region at 68.94.
Related Cryptocurrency Market News – MCO News