Cosmos (ATOM) Exhibits Dramatic Movement on 30-days chart

Cosmos reflected a moderate downtrend from February 2020 after a marvelous opening in January 2020. The first month marked an astounding surge to 5.2 USDT. The massive crash in March brought the ATOM price to 1.2 USDT. However, the price crash soon recovered and registered an improvement. The recovery was slow, yet the same brought solace for the traders.
Cosmos Price Analysis
 Cosmos (ATOM) Price News
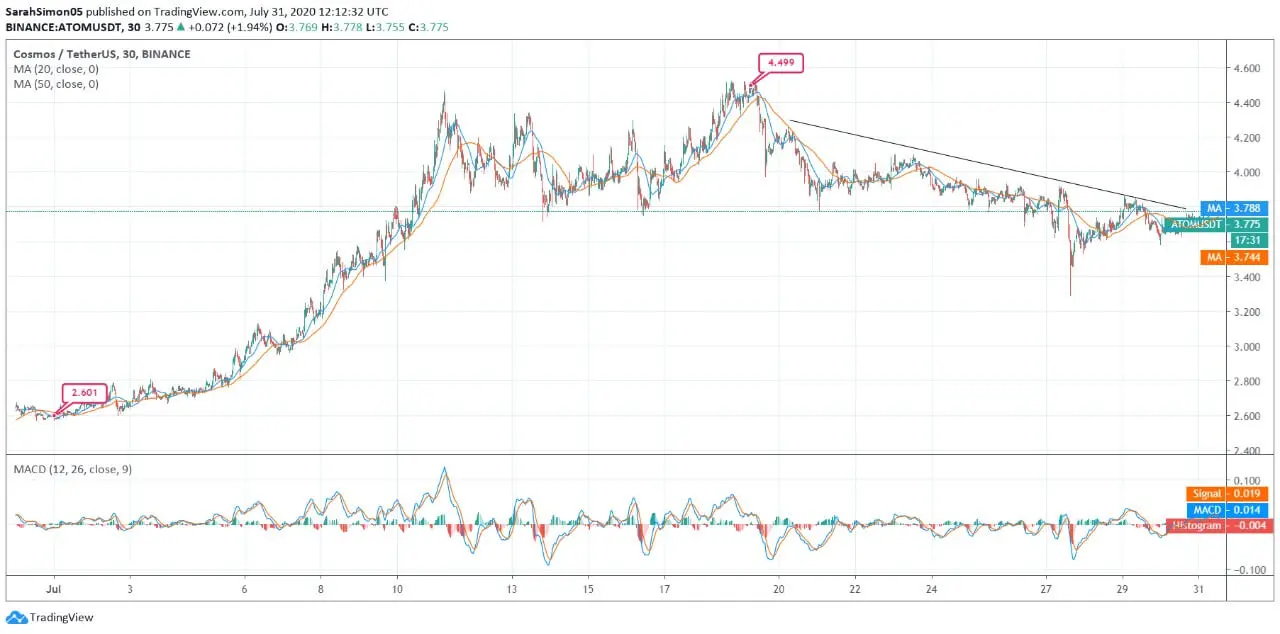
The month-long chart of the ATOM against USDT is reflecting a minor growth in terms of price despite the recent decline. The currency was trading around 2.60 USDT on July 01 with an upside momentum. The price began escalating after the next two days, and in the next week, the price reached around 4.40 USDT.
Later, Cosmos reflected steep price movements from July 10, and on July 19, the currency marked the month’s highest price at 4.49 USDT. However, after touching the highest mark, the ATOM price faced rejection, and in the next 3-days, it fell to $3.76.
The currency continued to trade under bearish hold downtrend since then, and at the press time, it spotted at 3.75 USDT. Despite a continuous fall from the last ten days, the coin is still a monthly gain.
The MA50 & MA20 are at $3.74 & $3.78, and the coin holds strong support from MA50. As per the MACD chart, the chances are ripe that there might be a short-term consolidation.