DAI is one of the Top 50 coins amongst the global crypto market and is trading above $1 after hitting an All-time High in March 2020. It was just during that time when the global markets crashed due to the outbreak of the Coronavirus Pandemic. The crypto is holding a market cap above $360 million with a long-term bullish bias.
As Bitcoin price continues to trade above $11k and now even beyond $11.5k. The majority of the cryptos of the entire crypto market are trading in green; however, DAI is not one of the gainers today as it draws a negative crossover with bearish candlewick.
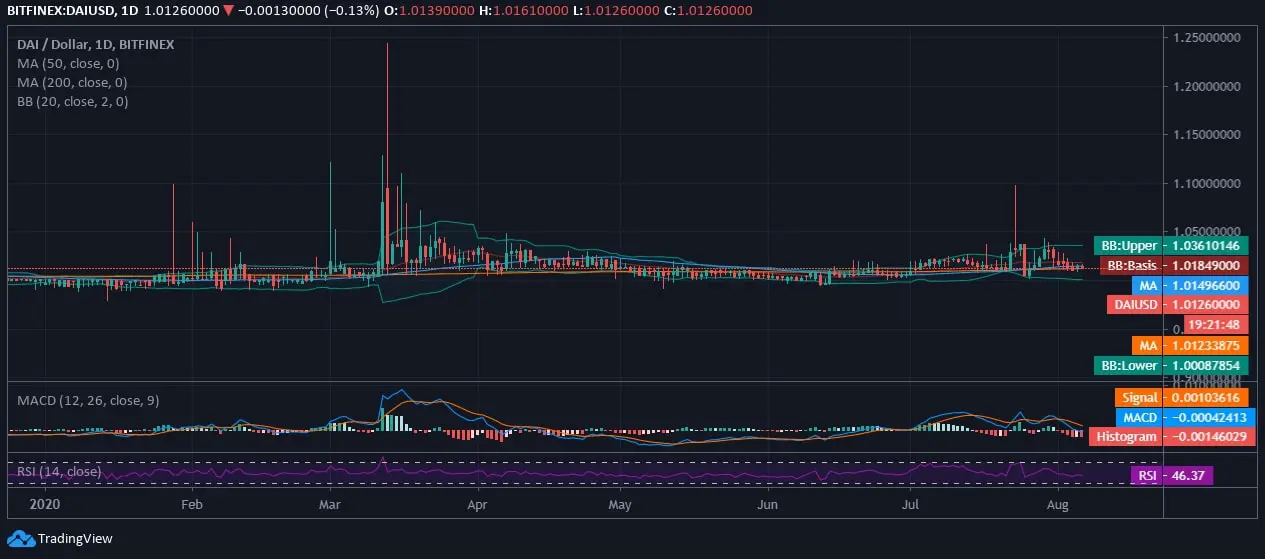
On the daily chart, DAI is trading at $1.012 against the USD with no support from the SMA50. The bearish candlewick has led to a bearish intraday crossover, but slight support from SMA200 is retained at $1.012.
Moreover, with the beginning of the ongoing year, we have seen bearish candlewicks, and the ATH hit around $1.25. Towards the end of the previous month, it rose as high as $1.10 briefly and is maintaining a flattish trend. The price trend of DAI/USD is not hitting any extremities on the laid 20-day Bollinger Bands, and we do not project any trading extremities whatsoever.
Although the intraday appears bearish, DAI/USD is far from hitting the lower 20-day Bollinger Band if it maintains its stance above $1.01 effortlessly. In this regard, the signal line is seen crossing above the MACD line while the RSI exhibits no extremities and lies at 46.37.