DigiByte (DGB) Draws a Flat Trend; Trades Below $0.025
DigiByte, one of the lucrative cryptos that gained handsomely during the altcoin season. DigiByte’s platform is making it all worth with strategic partnerships and the price dynamics of DGB coin is just an overview of the current consolidating flattish momentum.
Alongside, with concern to DigiByte platform and the recent partnership that it marked with PAC Global, where the latter has collaborated with quality projects including TRON, IPFS, and SafePal Wallet too.
PAC Global, a quick, easy and secured way to transfer PAC coins globally is seen making gainful partnerships to amplify the platform and create a win-win situation for all the platforms aligned.
Moreover, the use case of DGB is also staged and a Canadian company selling eco-filament for 3D printers which is made with recycled plastics at 98% will start accepting DigiByte shortly.
DigiByte Price Analysis
 DigiByte News
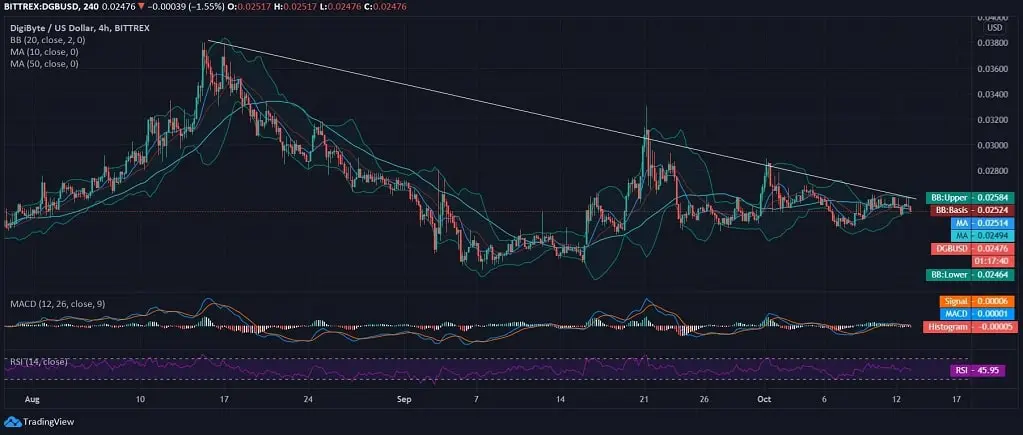
At the press time, DigiByte was seen trading around $0.024 after a gradual downtrend from a 2-year high marked at $0.0380. It has been over the past 2 months that DGB/USD has been sliding from the fresh YTD and 2-year high. However, the currency over the past two weeks has been trading in a narrow price range of $0.023 to $0.0267, while currently trades midway.
With a slight bearish sentiment prevailing in the intraday, the signal line is seen crossing above the MACD line on the 4-hourly chart. In this regard, the RSI is lying at 45.95 with no trading extremities hit over the past week due to no steep price change.
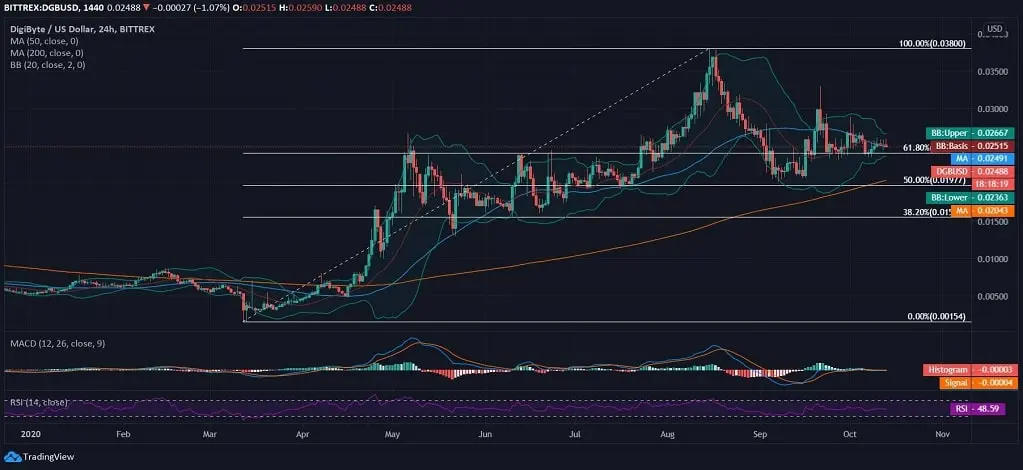
The YTD movement of DigiByte clearly shows a pullback from the YTD high and is maintaining its stance above 61.80% fib level with a choppy and volatile price trend against the US Dollar. On the above 24-hour chart, DGB/USD price trend is likely to have a possible breakout soon as the bands squeeze.
However, the current volatile movement had led to lacking support from MA50 but retains MA200 support at $0.02043. The technicals on the 24-hour chart appear same as on the 4-hourly chart with a flattish curve of MACD and signal line. The RSI is also flat and is away from hitting the trading extremities, lies at 48.59.