The cryptocurrency market underwent a heavy chain of events due to the pandemic. However, few coins marked decent growth despite the adverse situation. Hedera Hashgraph falls under the same category.
During the opening of 2020, HBAR price was trading around 0.00000141 BTC, but later, it marked steep upside movement. And now, the currency trades around 0.00000382 BTC. The improvement is astronomical. Recently, the price dropped and reflected the stagnant movement.
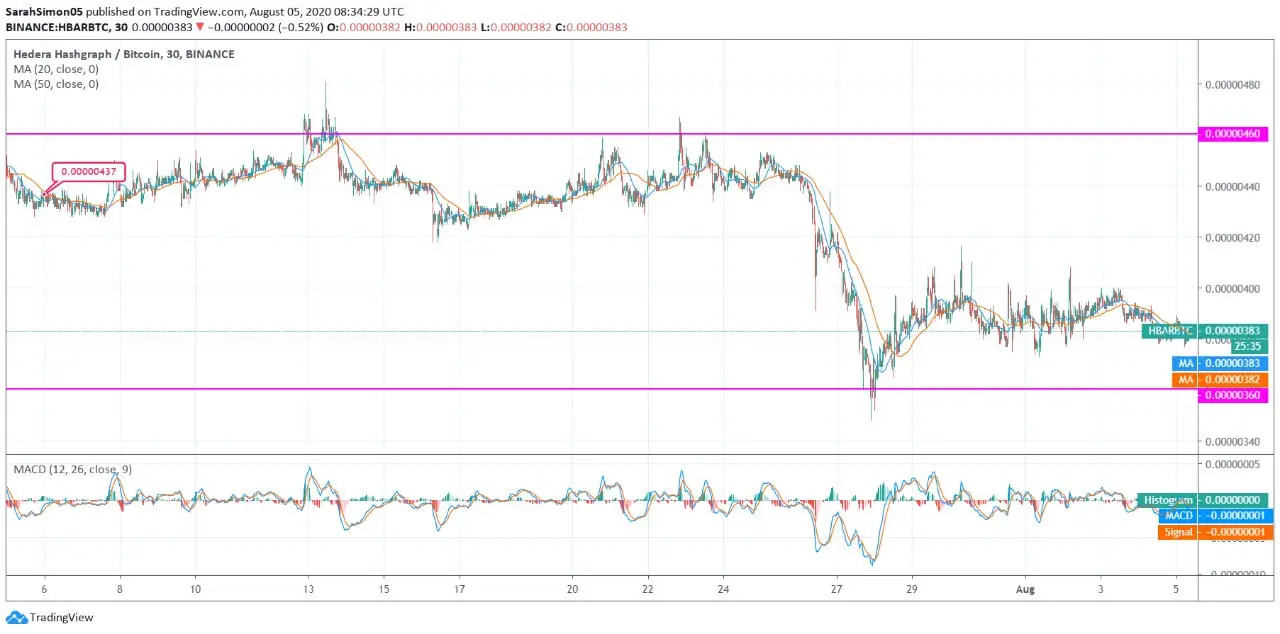
The price trend of Hedera Hashgraph for the last 30-days is exhibiting downtrend. The momentum is stagnant, yet the price crash seems substantial. The price of HBAR spotted at 0.00000437 BTC on July 06, 2020. The first week brought improvement in the currency, and the price breached its key resistance at 0.00000460 BTC. Later, from July 15 to 26, the currency was trading around 0.00000440 BTC.
Further, the market pressure strengthened, and the price of Hedera Hashgraph dropped. On July 28, the currency tested its immediate support level at 0.00000360 BTC. However, after this, the improvement took place, and on the next day, the HBAR price spotted at 0.00000383 BTC. However, from the beginning of the ongoing month, the coin is reflecting stagnant movement around 0.0000038 BTC.
The MA50 is at 0.00000382 BTC, and MA20 is at 0.00000383 BTC. The SMA lines are forming a bearish crossover. However, the current HBAR price holds support from both lines, and the MACD indicator is reflecting bullish crossover. We are anticipating the upcoming period might bring a recovery.