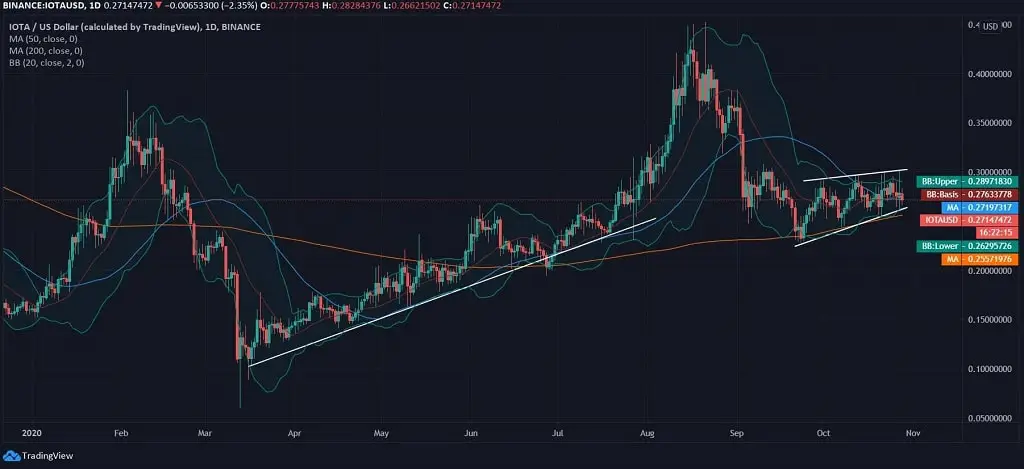
IOTA Draws a Rising Wedge Like Pattern and Trades at $0.271

IOTA, one of the top 30 coins of the market, is seen drawing a bearish crossover just like, and over the past two months, the coin is trading in a narrow price range of $0.228 and $0.306. At the time of penning down this analysis, the IOTA price was seen trading at $0.27 after drawing a slight rising wedge drawn from the lowest of $0.225 marked in the previous month.
In this regard, over the past two months, the coin has drawn two uptrends after a gradual pullback and testing of support at $0.228 in the previous month. The intraday is drawing no hopes and a bearish candlewick breaching the lower Bollinger Band on a 5-hourly chart.
IOTA Price Analysis: IOTA Shows Weak Momentum Near Support
 IOTA News
Today, the IOTA price was seen trading at $0.271 after drawing a slight rising wedge pattern on the daily chart. Alongside this, it was in the early half of the year when IOTA/USD drew an uptrend after the major market crash only to hit the YTD high at $0.45, followed by testing 3-month support around $0.22. On the same daily chart, IOTA holds support from MA200 while fails to reconcile with MA50, which is slightly below the current trading price.
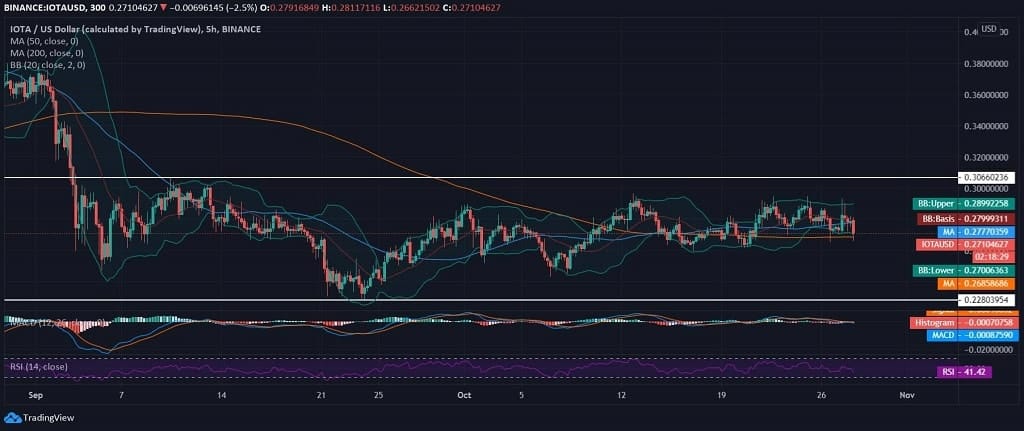
Emphasizing the 5-hourly movement of IOTA against the greenback, we cannot ignore the price trend, which shows a choppy pattern, and the intraday is leading to draw a bearish crossover on the MACD chart. The MACD indicator draws a negative sentiment with respect to the recent price movement. The RSI also holds a clear inclination towards the support area and lies at 41.42.