
The Qtum has spotted volatile movement from the beginning of 2020. The coin started the year with a stupendous momentum, but the trend reversed from mid-February to the first week of March. However, the currency regained momentum, and this time the uptrend seems to stay for a considerable time. The improvement in the pace of QTUM has astounded the traders.
QTUM Price Analysis
 QTUM Price News
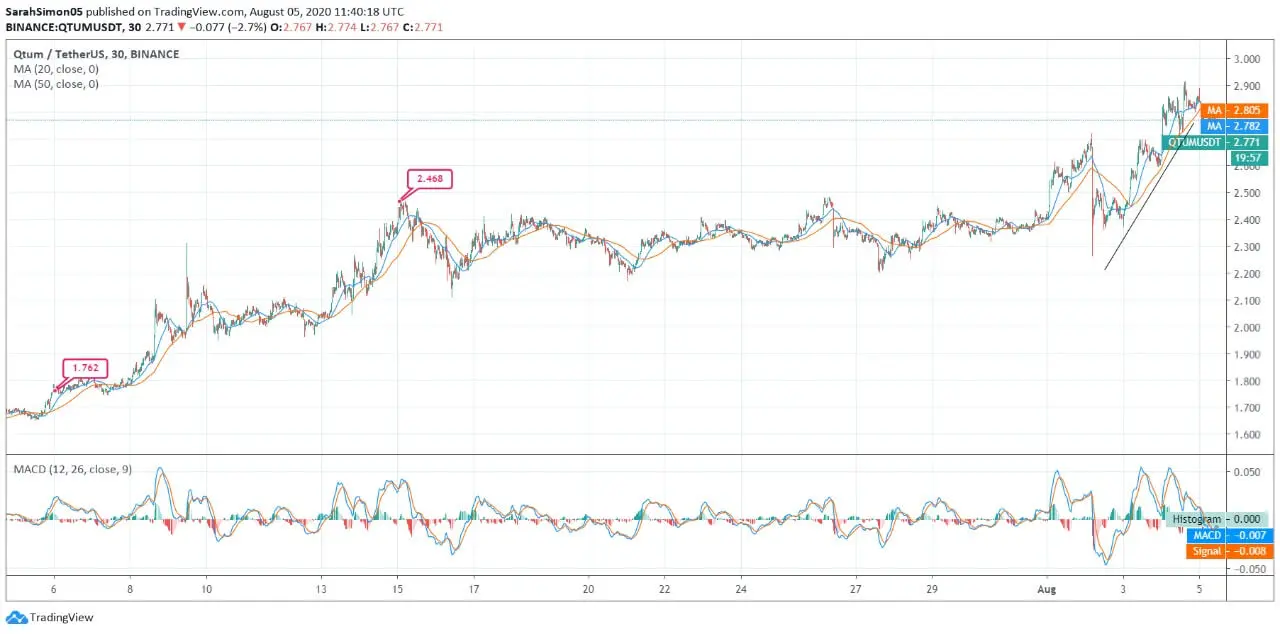
The price trend of QTUM is exhibiting a month-long uptrend. On July 06, the currency was trading at 1.76 USDT. In the period of next week, the price escalated to 2.00 USDT. The escalation continued, and the Qtum price touched 2.46 USDT. Later, with a slight plunge to 2.10 USDT, the coin recovered again to 2.40 USDT mark. The currency reflected stagnant movement around the level until the end of the month.
In the ongoing month, the QTUM coin marked a decent hike and reached 2.77 USDT. However, due to selling pressure, the currency faced a steep decline and fell to 2.30 USDT. The coin recovered again and retested to 2.77 USDT.
The SMA lines of 50 & 20 days are at 2.80 USDT and 2.78 USDT, respectively. The lines are forming a bullish crossover. The MACD chart reflects bullish crossover, but the lines are headed downwards.
The mixed indications by the indicators usually point towards a sluggish movement. The upcoming days might spot another stagnant period in Qtum.