VeChain (VET) Draws a Falling Wedge; Trades Above $0.0110

VeChain is one of the lucrative cryptos that is now ranked amongst the top 30 of the global crypto market, currently trading above $0.0100. It was just towards the end of the previous week when VeChain was seen integrating with Native Meta to take a strategic move in terms of amplifying transaction features.
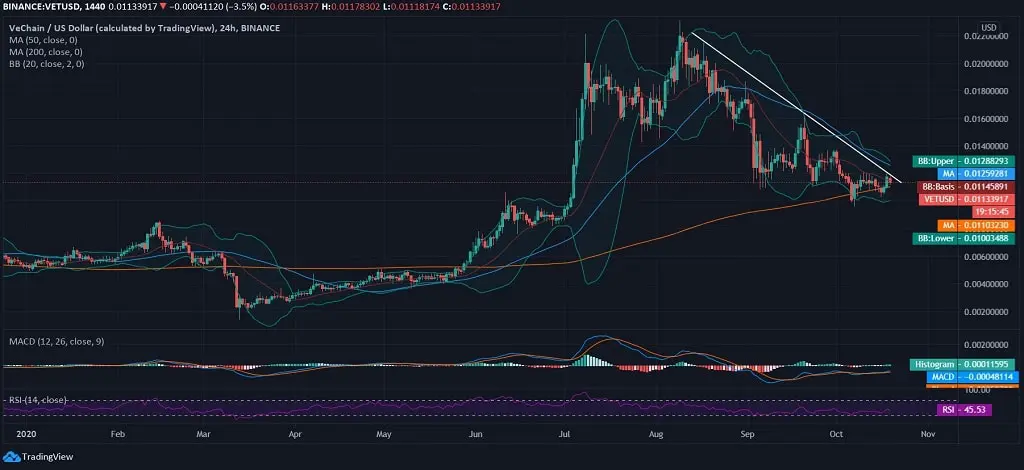
Although, VET price is seen drawing a falling wedge, at the moment with a downtrend extended from the 2-year high marked in August 2020. While the currency gained over 1400% until the last quarter, it lost a mere 51% in 2 months from the 2-year and YTD high.
#VeChain X Native Meta-Transaction Features
Some features which make VeChain more friendly for enterprise adoption.
– Controllable Transaction Lifecycle
– Multi-task Transaction (MTT)
– Multi-party Payment (MPP)
– Transaction dependency$VET pic.twitter.com/4fqjfrp8cw— Martijncvv Ⓥ | 👨🎓 = 🔑 (@Martijncvv) October 17, 2020
Since the crypto market is seen drawing a volatile move over many days of the ongoing month now, it is a positive site that it is maintaining its trading stance above $0.0100. In this regard, VeChain is one of the top 10 altcoins over the past 24 hours as per the list given by LunarCrush Social Listening for Cryptocurrencies.
Top 10 coins by AltRank™ as of 4:51PM UTC Sun, Oct 18 on https://t.co/yjRT0lx8PN
1 $YFI #yearnfinance
2 $RSR #reserverights
3 $UNI #uniswapprotocol
4 $VET #vechain
5 $YFII #dfimoney
6 $UMA #umaprotocol
7 $ANKR #ankr
8 $TRB #tellor
9 $OKB #okexutilitytoken
10 $LINK #chainlink pic.twitter.com/PZfGzqjgkv— LunarCRUSH Social Listening for Cryptocurrencies (@LunarCRUSH) October 18, 2020
However, the VET/USD is clearly drawing a falling wedge; it is not away from its bullish candlewick breakout leading to a great social activity over the past 24 hours.
VeChain Price Analysis

Trading in the last quarter, VET coin, just like any other crypto, does not draw a certain movement and aggravates a downtrend. VeChain trades at $0.0113 with over 50% loss in the price from the YTD and two years high. However, as the MACD chart reflects a slight bullish divergence de to intraday bullish candlewick, it is away from hitting the lower band as it did at the onset of the month.

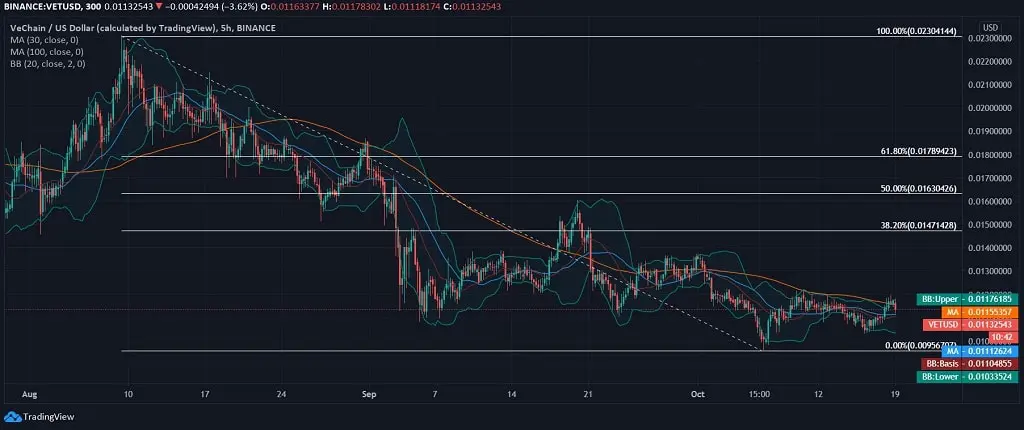
While we take an emphasized look at the 5-hourly movement of VET/USD, we see that the coin is trading below 38.20% fib level since the beginning of the month with grounded support from 30-day MA but fails to retain 100-day MA after nosediving from $0.0115, in the nearest term.


