Bitcoin SV Appears Intraday Bearish and Lacks Steady Support

Bitcoin SV price slipped below the top 10 cryptos of the market is now ranked at 11th position after a change in Market capitalization due to price-led demand. However, just like any other altcoins of the market, BSV is also seen correcting with a price slide over the past ten weeks against the greenback, and with intraday bearish nature, the coin has no support from the daily MAs on the 24-hour chart.
Bitcoin SV Price Analysis
 Bitcoin SV News
As the market sentiment is beyond doubt volatile, BSV is seen experiencing the same the volatile pullback, while the price of BSV/USD is already moving with a flattish trend over the past six weeks, just like the majority of its pattern observed in the 2nd quarter of the ongoing year.
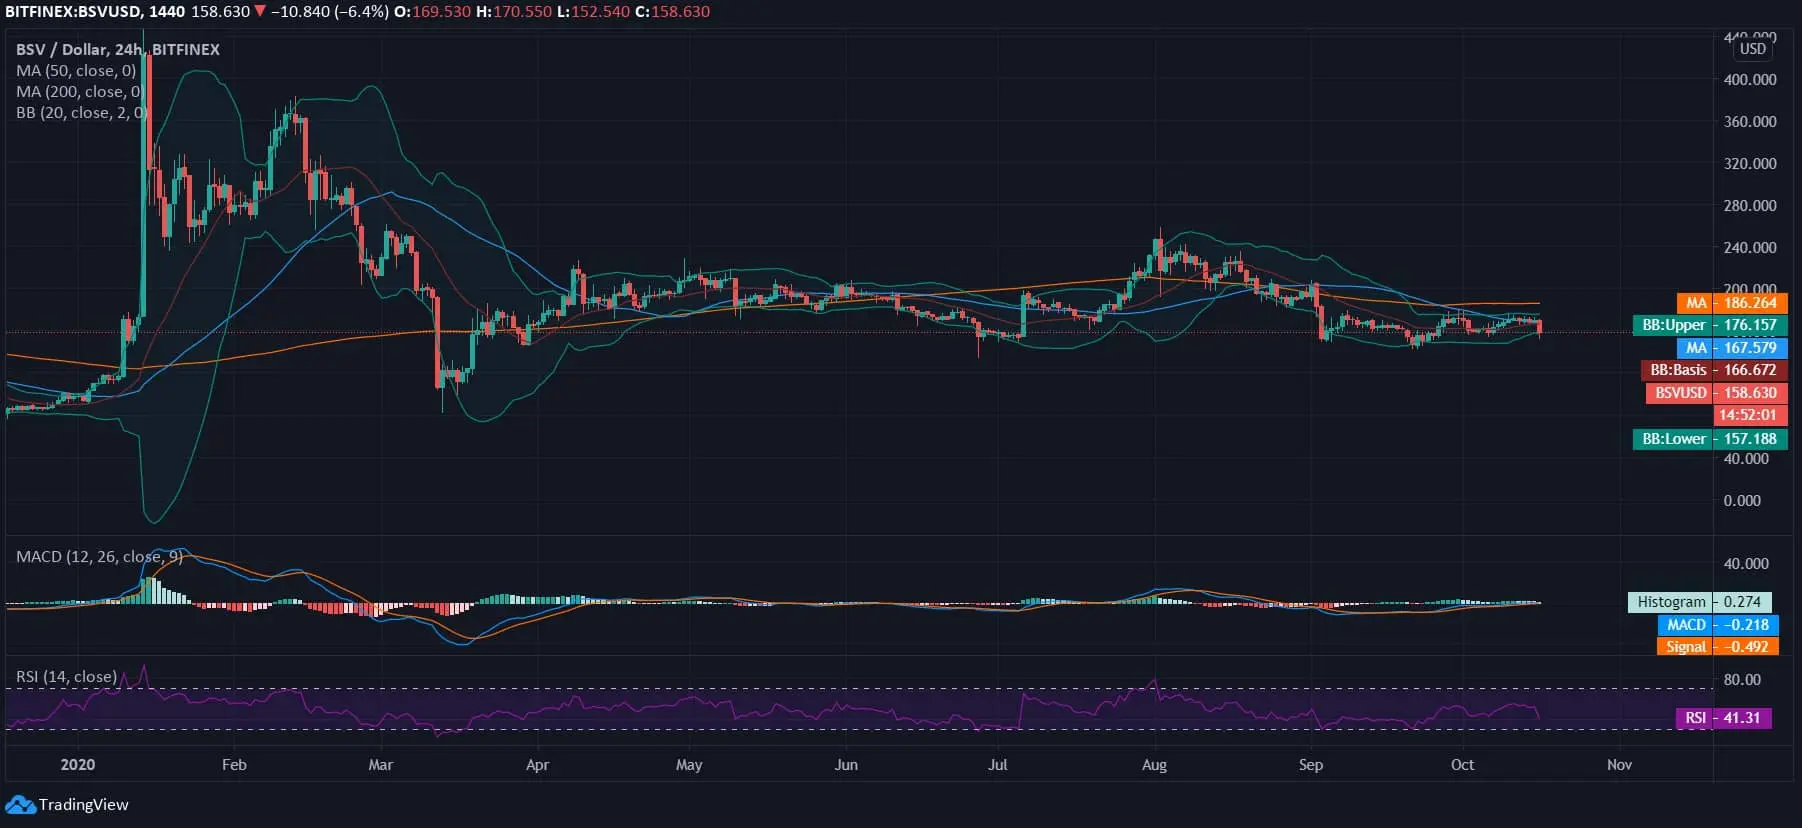
Bitcoin SV was seen trading at $158.63 after a bullish candlewick on the daily chart today. With intraday downside correction, the pair breaches the Bollinger Bands, and as the Bands squeeze, a possible breakout may happen sooner than later.
Although the price trend appears flat, the intraday volatility is not at bay, and therefore, Bitcoin SV is seen lacking support from MA50 & MA200 at $167 & $186, respectively. The currency has lost over 35% from trading around $257 in August to trading below $200, with strong support at $150. However, the MACD indicator still holds a slight bullish crossover due to no abrupt change in price dynamics. The RSI is seen nosediving with a parabolic curve and lies at 41.31.
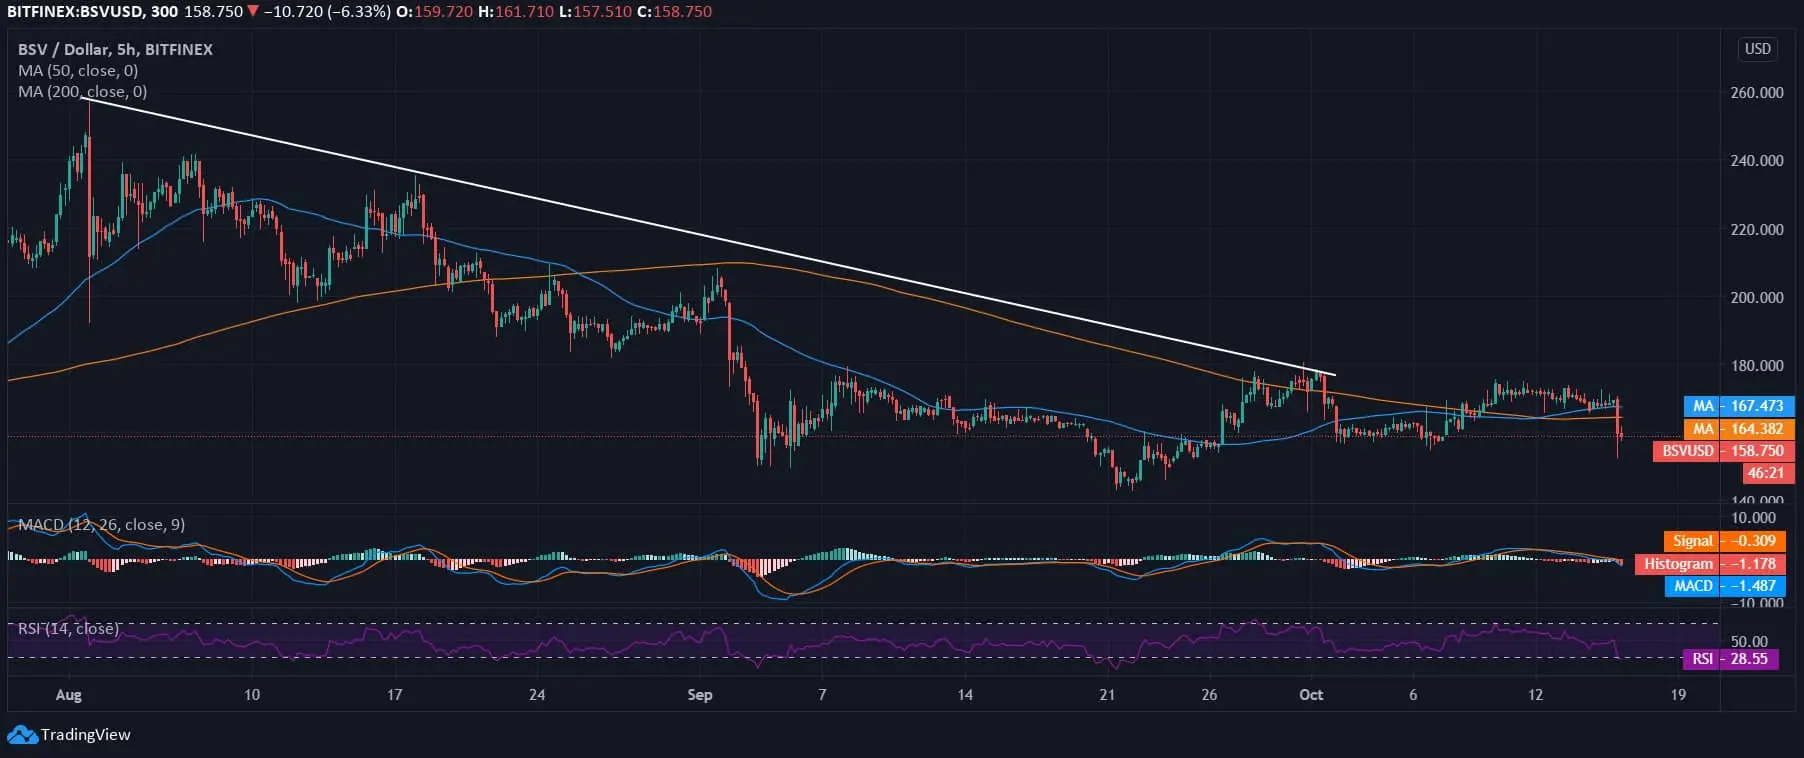
Emphasizing the 10-week movement of BSV/USD is seen drawing a downtrend and holds a lower high pattern on the above 5-hourly chart. With intraday bearish candlewick, around the time of writing is seen drawing a bearish crossover on the MACD chart and, in the process, all lost support from MA50 & MA200 at $167 & $164, respectively. In this regard, the RSI is also seen experiencing a steep pullback and lies at 28.55, testing major support below 30.