Litecoin (LTC) Appears Intraday Bullish; Faces Resistance at $50

Litecoin, one of the top 10 cryptos of the market, is seen trading at slightly below the major resistance at $49.12 on an 8-hourly chart against the US Dollar. On the same chart, LTC price gained steeply towards the end of July 2020 after breaching the price accumulation and hit a 5-month high around $65 in August 2020.
With a volatile movement recorded thereafter, Litecoin following the market momentum drew many volatile crossovers in the past quarter with a stringent resistance marked at $50 & $70. At the time of penning down this analysis, the LTC price was seen trading around $49, and due to a strict rejection at and above $50, the coin has been trading around the current price for most of the time.
The recent bullish candlewick at the intraday end appears to breach the upper band and retains support from 50-day MA at $48. However, with considerable resistance, Litecoin price lacks support from 200-day MA lying at $51.
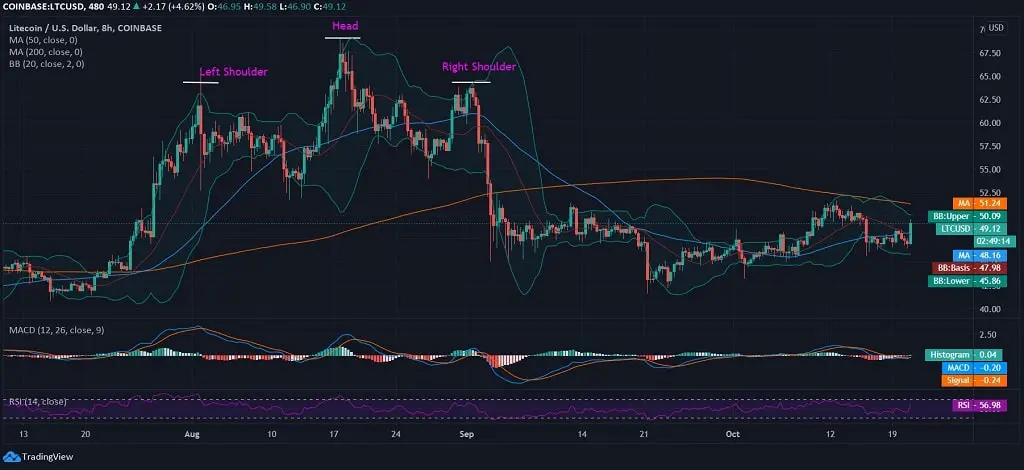
Moreover, LTC/USD drew a clear head and shoulder pattern, after which the coin tested supports as low as $41. Thereafter, it could draw a small uptrend with the highest of the past two months marked at $51 just to dip yet again below $50.
The MACD chart is still under the bearish divergence as the Litecoin price is not yet out of the negative radar and bearish pull. The RSI, however, is seen rising with a steep trend towards the overbought region due to intraday bullish candlewick and lies at 56.98.