Ravencoin May Initiate Recovery After Retesting Its Support

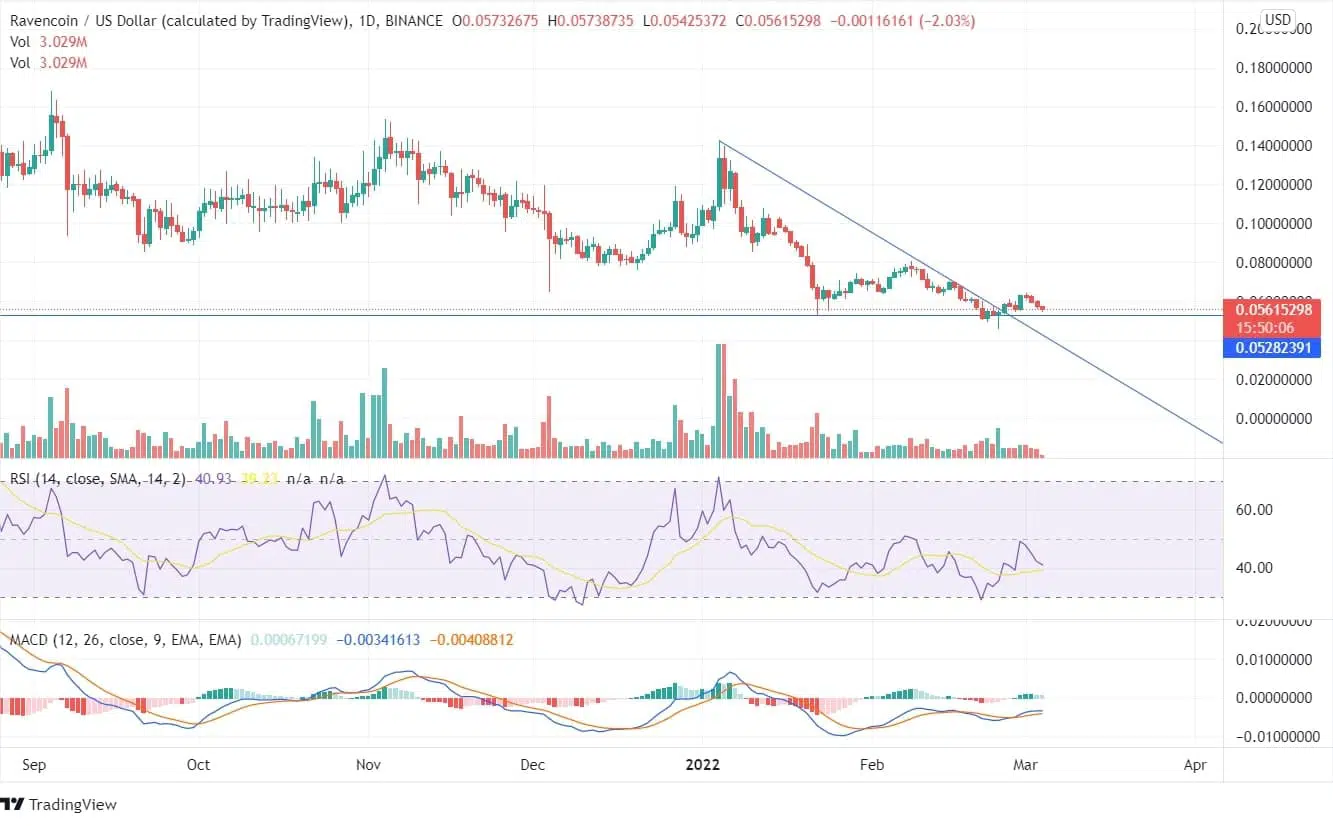
Ravencoin is forming a lower low after dropping down constantly from its high of $0.10. The coin was at its resistance during the beginning of January; however, it was a gainful asset for the bears in the last two months. The RVN coin price was moving below the down trend line, though on February 25, the price tried to suppress the trend line and close above it but couldn’t cross the high of $0.064, followed by the formation of bearish candles.
In an intraday session on February 28, the coin showed a rise of 20%. RVN is heading towards its support line of $0.053, from where it may turn around if the bulls push the price up. On February 24, the price got tested at the support line but couldn’t close below it, and a swing low was formed. On the same day, there was supporting bull volume, and the coin showed a rise in the price from its lows of $0.04 to highs of $0.06.
 The MACD indicator shows green candles, indicating a bullish signal. The RSI indicator is at 40, being currently neutral. Based on the RVN price prediction, a strong upside momentum can be expected once the price closes above the recent peak. For the last four days, the bears have been pushing the price down, and the bearish candles are being formed.
On the weekly time frame chart, the past week’s candle shows that neither the bulls nor the bears could take a major price action. The price closed nearby to where it opened though there was an overall price movement of 50%. For a long-term investment, the traders can wait for the candle to close above the swing high of $0.06 for a bullish trade and to close below the swing low of $0.04 for a bearish trade.
The coin is exactly at the same position from where the bullish candles were formed, and the price rallied to its high of $0.18. The forming candle shows that though the bulls are trying to push the price high but are unable to get it close near its high.


