Bitcoin appears like a reminiscence of the previous month’s trend just as we near the closing of the moderately volatile yet flattened month. BTC, on the last weekend of August 2020, is trading with a flat price trend against the US Dollar and is facing a complete rejection above $12k, with thrice intermittent spikes above $12k over the past 30 days.
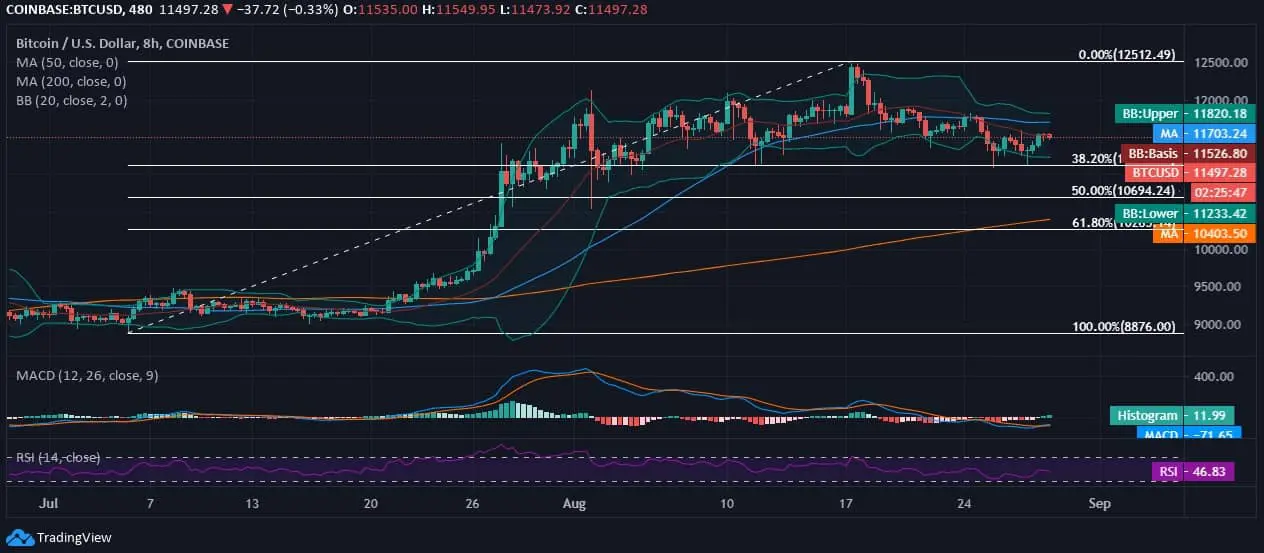
However, with consistent range-based trading, BTC/USD is testing supports near 38.20% Fib Retracement Level around $11,100. The intraday has been super sluggish now and is drawing a bearish crossover.
Bitcoin is often compared to other investment avenues like stocks ETFs and while the financial system decides what is friendly for the economy—Fiat or Bitcoin. Well, this Pandemic has proved everything that an unlimited printing of bills is nothing but hyperinflation, and a limited supply of $21 million is the ultimate power.
The limit here is the USP of Bitcoin, which is leading to ZERO manipulations through limitless printing of money. The monetary policy is nothing but an inequal distribution of money, and however, the increased printing of bills is not even leading to eradicate the major concerns.
Bitcoin is a complete synonym of freedom, and by the freedom, it means a complete and sheik of the economy.
Bitcoin Price Analysis: Key Levels and Market Signals
 Bitcoin News
Bitcoin trades around the midpoint at $11.5k, at the press time, and over the past 30 days, it has been trading above 38.20% Fib retracement level. If we take reminiscent of the previous month’s trend, BTC was in the last week that when the price grew from trading below 61.80% to spiking above 38.20% Fib level at the onset of the ongoing month.
With intraday bearishness, Bitcoin lacks support from MA50 after sliding below $11.7k but is holding complete support from MA200 at $10,400. The BTC price after breaching the lower Bollinger Band is now within the range and is now moving towards a short-term bullish crossover on the MACD chart.
After a notable bearish divergence on the 8-hourly chart, the MACD line is now moving towards intersecting and crossing above the signal line. The RSI is holding no extremities due to no abrupt change in price dynamics and is lying at 46.83.