Cardano—One of the Top 10 Cryptos is an Illustrious Performer

Cardano—the third generation crypto is now trading below $0.13 after having traded bullishly above $0.14 over the past weeks. However, ADA is maintaining a clear trade above $0.100, and after Shelly in progress for the blockchain platform, the native token is not likely to dip below $0.100—the major support.
Cryptocurrencies have proved their worth over the period. In this time of the Pandemic, Fiat and the US Dollar is no longer the same standard currency due to unlimited printing in a barely surviving economy. With this, Cardano is modern crypto after the 1st and 2nd generation Bitcoin and Ethereum, but is it an already forgotten DeFi?
Well, Cardano’s major use is just staking but diversifying the portfolio as per individual’s risk and return calculated ratio, it can or cannot be a DeFi investment. Cardano undoubtedly has a solid base and is a peer-reviewed project, and the team at IOHK is completely dedicated to following their roadmap and has a great future. One of the top 10 blockchains of the market is now an illustrious performer.
Cardano Price Analysis: ADA Holds Key Support Levels
 Cardano News
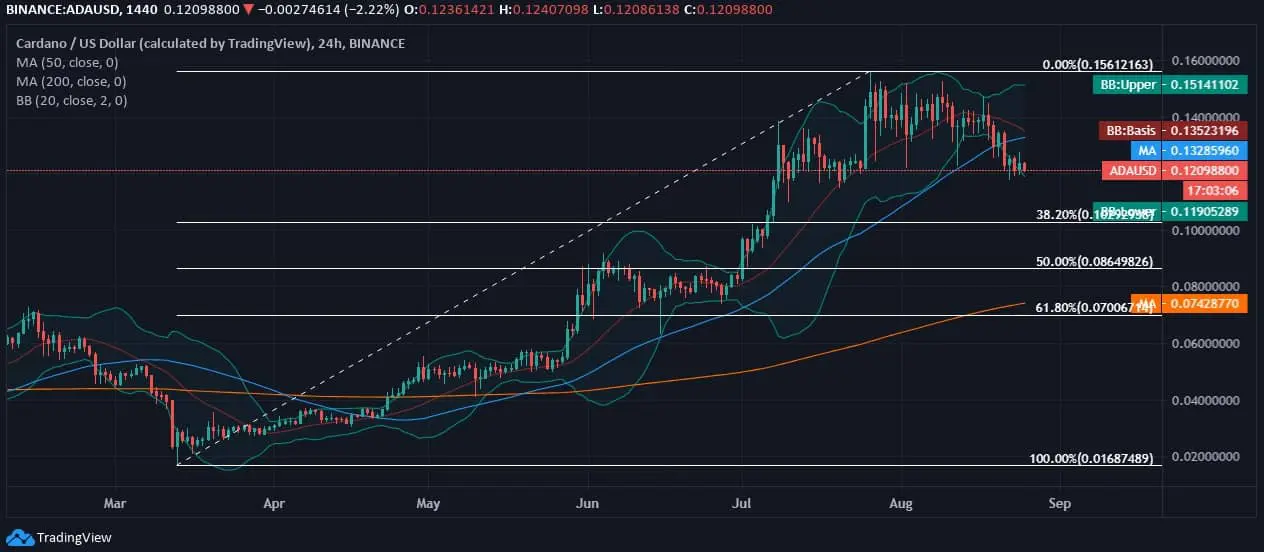
At the time of penning down this analysis, the ADA coin was trading at $0.120 with a pullback from the 2-year high above $0.15 in the previous month. Right after breaching the 2-year long resistance above $0.15 at $0.156, Cardano tested the lowest around $0.11 towards the end of the previous week. After having drawn a downtrend over the past week, ADA/USD is now hitting a lower Bollinger Band on a 24-hour chart. However, the downtrend can be subsidized against the higher high pattern observed in the above chart after the last week of April and is readily above the 38.20% Fib level after consolidating downsides.
However, after having dropped below $0.13, Cardano has lost support from daily 50-day MA at $0.132 while still retains 200-day MA support at $0.0742.
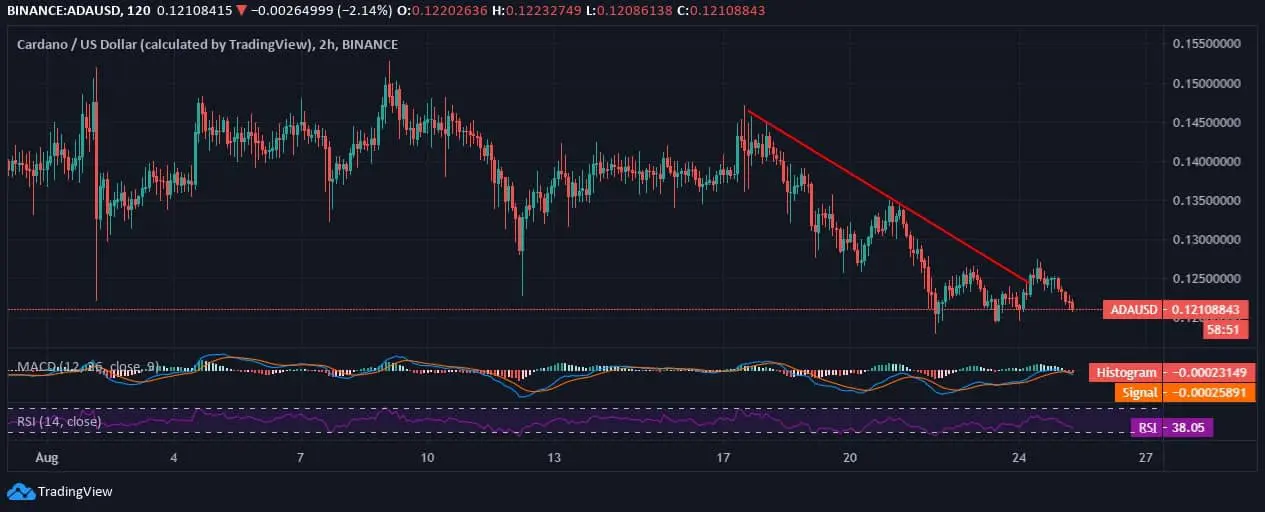
Over the last 25 days since the beginning of the ongoing month, ADA/USD has dipped twice below $0.125 before trading persistently below $0.125 over the past five days. The downtrend stretched from $0.145 price area below $0.125 is a clear bearish indication at present. In this regard, the MACD chart holds a bearish divergence, and the RSI is inclined towards the major support at 38.05.