Dow Jones vs NASDAQ vs S&P 500 | What’s the Difference?

- Dow Jones accounts for only 30 large companies listed on the New York Stock Exchange while the NASDAQ Composite market index accounts for around 3000 stocks from the tech & high growth sectors. And the S&P 500 is accounting for about 75% of all US stocks which considered the “Best Single Gauge” of the current US equity conditions.
Dow Jones, NASDAQ, and S&P 500 are the three most popular US market stock indices that are often considered as the barometer of the overall financial condition of the US economy. Stock market indices provide the overall market summary by tracking some of the top stocks in that particular market. However, every index does not track stocks in the same way. Some indexes represent stocks of both the small and large companies, whereas some others represent stocks of only the large companies. Let us discuss the top three market indices in detail.
Dow Jones:
The Dow Jones market index or the Dow Jones Industrial Average (DJIA) is more commonly known as the second oldest stock market index in the US. It was propounded by the renowned journalist of the ‘Wall Street Journal’, Chares Henry Dow, and his business partner Edward Jones, after whose name the index got its name. Charles Dow created this index in the year 1896, by taking an average of the stock prices of 12 top publicly traded blue-chip companies mostly from the industrial sectors. Stocks with the highest prices were given greater weights in the Dow Index, which implies that a greater movement in the higher-priced components will lead to more impact on the final value. Charles Dow calculated the average by adding the overall stock prices of all the 12 components and then dividing the result by 12.
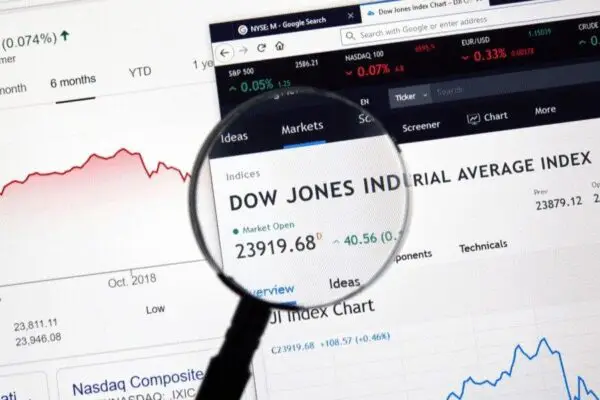
However, with time there have been many alterations in the index, such as stocks stock splits and mergers that needed to be taken into account, and so now simple arithmetic mean calculation is no longer relevant. Therefore, sometimes the Dow Jones equity index is criticized for not being adequate in measuring the overall US stock markets; presently, it includes only 30 large companies listed on the New York Stock Exchange.
Also, it does not use weighted arithmetic mean like its contemporary market indices like the S&P 500.
When Dow Jones started indexing stock markets, it mainly included companies from the operation and service sectors like railroads, gas, cotton, tobacco, oil, and sugar. The performance of these industrial sectors measured the country’s overall economic condition, thereby making Dow Jones Industrial Average, the key tracker of the US’s overall economic status. Charles also found that the overall stock market movements can be easily tracked when the average of the stock prices is taken into account. However, with time, the dependence of the economic condition in the US stock market has shifted to other additional sectors; the DJIA is still considered the master barometer of the US stock markets’ economic well-being.
The Dow Jones Industrial Average contains some big companies like Apple, Microsoft, Boeing, Exxon, and Coca Cola.
NASDAQ:

The NASDAQ or the National Association of Securities Dealers Automated Quotations is the most recent index to measure stock performances. It includes some of the largest non-financial components mainly from the tech sectors; the tech-based companies are given the heavy weightage in the index. The NASDAQ 100 is ranked the second after the New York Stock Exchange that measures the performance of stocks based on share market capitalization. NASDAQ is a term that can refer to both an exchange as well as an index. When NASDAQ refers to an index, it is more specifically referring to the NASDAQ Composite Index. The NASDAQ Composite index is nothing but a statistical measure of a particular portion of the stock market. More specifically, the NASDAQ Composite market index includes around 3000 stocks mainly from the tech and high growth sectors like Apple, Cisco, Microsoft, Dell, and Oracle, and it also helped to modernize the IPO.
S&P 500:

The Standard and the Poor 500 is also a popular stock market index that measures the market stock performance of 500 top companies weighted by market cap listed on the New York Stock Exchange. It was created by an American financial services company named the Standard and the Poor’s Financial Services LLC in 1962. The S&P 500 includes stocks from all sectors of the economy, thereby representing the US economy’s broadest measure. Stocks having a market cap of $8.2 billion or more and a public float of at least 50%, positive earnings for the last 4 quarters, adequate liquidity by price and volume are included in the S&P 500. It is a large cap-weighted index and includes some of the largest companies like Apple Inc., Microsoft, Berkshire Hathaway, Facebook, Alphabet A(Google), Amazon.com, Johnson & Johnson, Visa Inc., and Procter & Gamble.
The S&P 500 is considered as the “Best Single Gauge” of the current US equity conditions accounting for about 75% of all US stocks.
Difference of Dow Jones vs NASDAQ vs S&P 500
All three of these indices, namely Dow Jones, NASDAQ, and S&P 500 are the US’s popular stock market indices. Still, each one has a specific basis of calculation, trading strategies, and volatility measures. Let’s find out the differences between Dow Jones vs NASDAQ vs S&P 500.
1) Abbreviation and Definition
Dow Jones stands for Dow Jones Industrial Average and takes into account 30 of the largest industrial companies traded on the New York Stock Exchange.
NASDAQ stands for the National Association of Securities Dealers Automated Quotients and takes into account only the top tech companies traded on the NASDAQ exchange.
S&P 500 stands for Standard and Poor’s 500 and takes into account 500 of the largest companies traded on the New York Stock Exchange.
2) Basis of calculation
The Dow Jones Industrial Average or the Dow Jones index measures the stock performance by weighing each component based on share prices and then applying a divisor to the final value. In simple terms, the Dow Jones Industrial Average is calculated by adding up all the individual weights based on the share prices of all the 30 components and then dividing the result by a divisor. It does not consider market caps. The divisor is not constant, and it is adjusted regularly.
Whereas the NASDAQ 100, index is a weighted index, based on market capitalization. The NASDAQ is calculated as follows:
NASDAQ-100 Index = aggregate value of the Index share weights X last price of the share / Divisor
Calculating the S&P 500 index requires adding up the adjusted market caps of all the stocks and then dividing the result by a divisor. The divisor here also is not constant and is adjusted regularly when there are dividend payouts or stock splits. Therefore, the formula for calculating the S&P 500 is:
S&P 500 index = Aggregate of all S&P 500 stocks / Divisor
3) Volatility
Dow Jones is the least volatile of these three major indices because it involves mainly slower moving components. The Nasdaq 100 is the most volatile, because of its high concentration in the riskier and high growth companies like Facebook and Amazon. S&P 500 is somewhere in between the two indices in terms of volatility.
4) Nature of stock index performance
The Dow Jones index is the primary index that is used by public market commentators and news agencies. It is the oldest and the most popular index, but it includes just 30 stocks and is calculated with the price-weighted system, which is sometimes not adequate. The NASDAQ, on the other hand, lays more emphasis on tech companies. The S&P 500 lays more emphasis on the broader stock movements and involves 500 stock components that are weighted by market cap.
5) Trading Differences
Despite the strong correlation existing among all these three indices, each of the indices has a distinctive way of trading. Each of the three indices, namely, Dow Jones, NASDAQ, and the S&P 500, respond distinctively to the price fluctuations of a single stock. The performance of individual stocks impacts the Dow Jones index significantly, whereas the S&P 500 index is the least impacted by the performance of any single stock. In the NASDAQ index, the top 10 stocks account for 50% of the index, thereby leaving 90% of it to account for less than 50% of the index’s value. Therefore, this makes the NASDAQ index highly sensitive to price fluctuations in a few selected stocks.
Therefore, there are various indices to measure the performance of stocks of various companies. If you invest in the US market, it is very important to understand the differences in the US market indices. Like, if you are keen on investing in tech companies, then you can follow the NASDAQ. If you are interested in small service sector companies, then you need to follow the Dow Jones index.